Update, November 2026: How this map changed
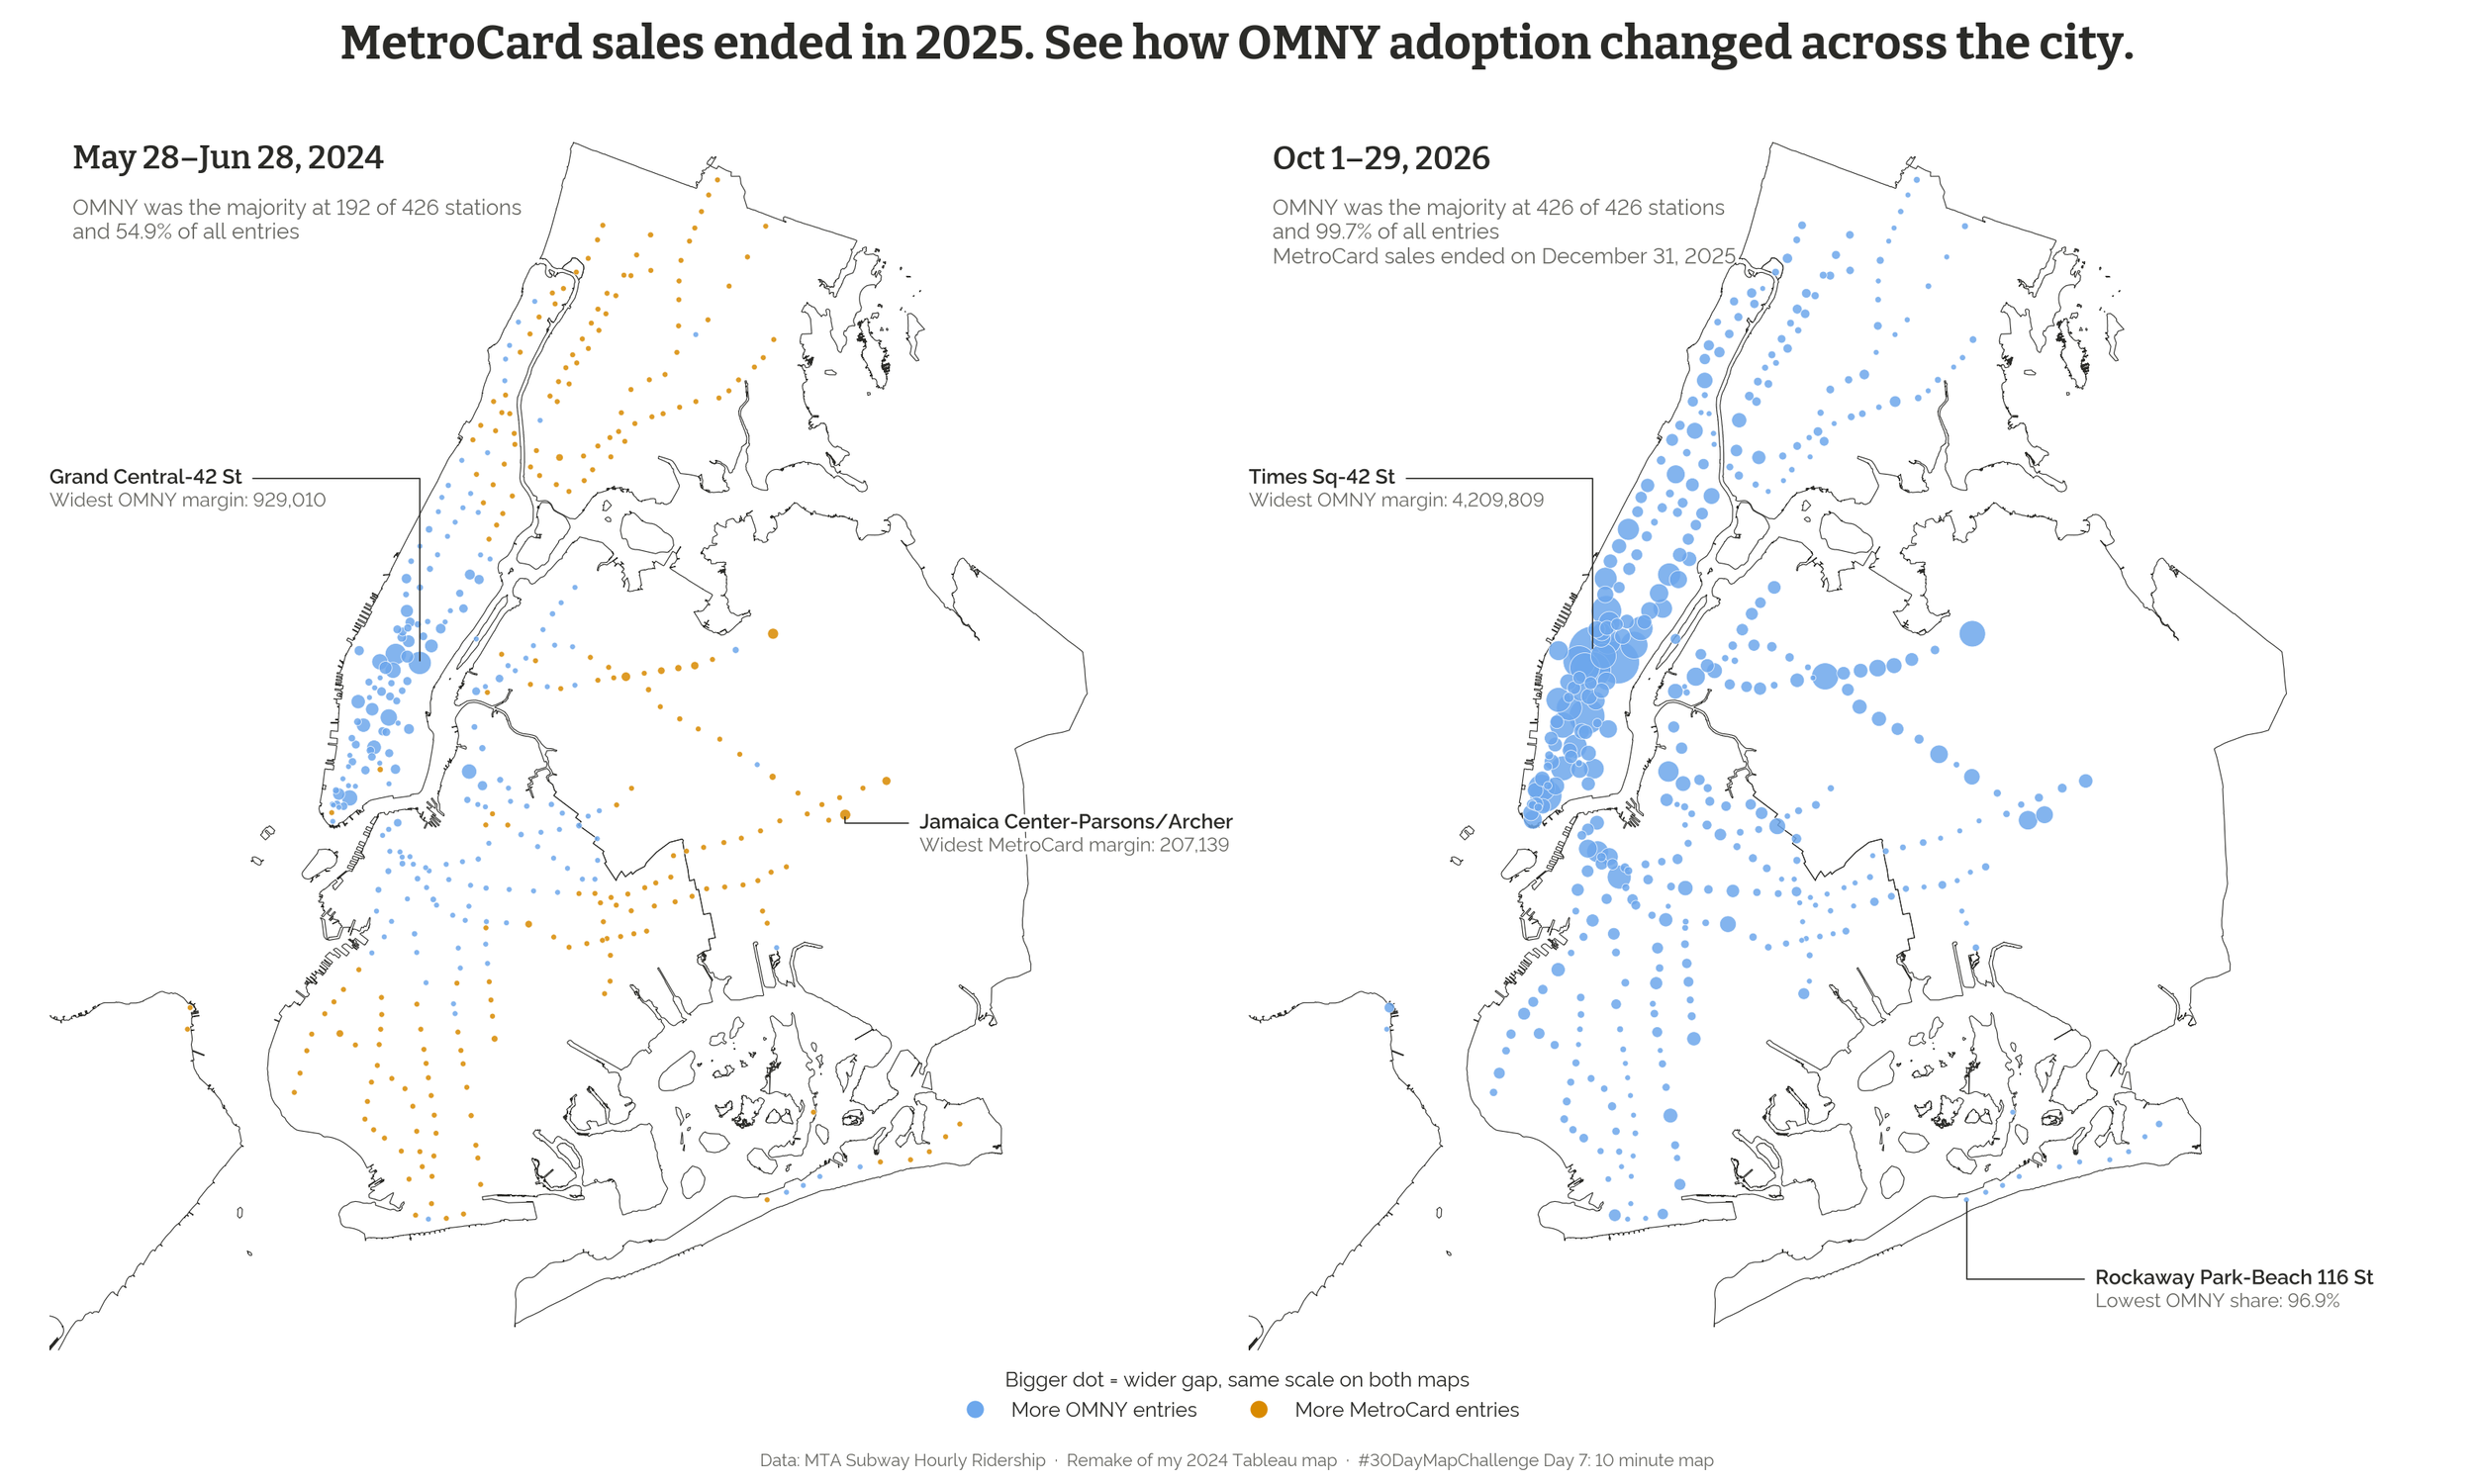
MetroCard sales ended on December 31, 2025, so I went back to this map to see how it had aged. I remade it for the 30 Day Map Challenge, and you can explore the new version here.
What I changed
I pulled station-level entries directly from the MTA’s ridership data for the same dates as the original, May 28 to June 28, 2024, and added the latest month available, October 1–29, 2026. A toggle switches between the two periods.
What it shows now
In mid-2024, OMNY made up 54.9% of entries citywide and was the majority at 192 of 426 stations. The split was real, but less tidy than I described below:
Manhattan: OMNY majority at 95 of 121 stations, 60.4% of entries
Brooklyn: OMNY majority at 70 of 156 stations, 52.2% of entries
Queens: OMNY majority at 25 of 79 stations, 46.3% of entries
Bronx: OMNY majority at 2 of 68 stations, 38.5% of entries
Staten Island: OMNY majority at 0 of 2 stations, 37.5% of entries (Only 2 of the 21 stations on Staten Island collect fares)
So calling OMNY “predominantly used” in Brooklyn overstated it: OMNY had a slight edge in total entries there, but a majority at fewer than half of its stations.
By October 2026, OMNY made up 99.7% of entries and was the majority at all 426 stations. Even the lowest share, at Rockaway Park-Beach 116 St, was 96.9%. That doesn’t show riders simply prefer OMNY, since new MetroCards were no longer for sale. Much of the shift came earlier, though: OMNY’s share was already 89% in October 2025, before sales ended.
As with the original, this map shows where the change happened, not why.
Below is the original post from July 2024.
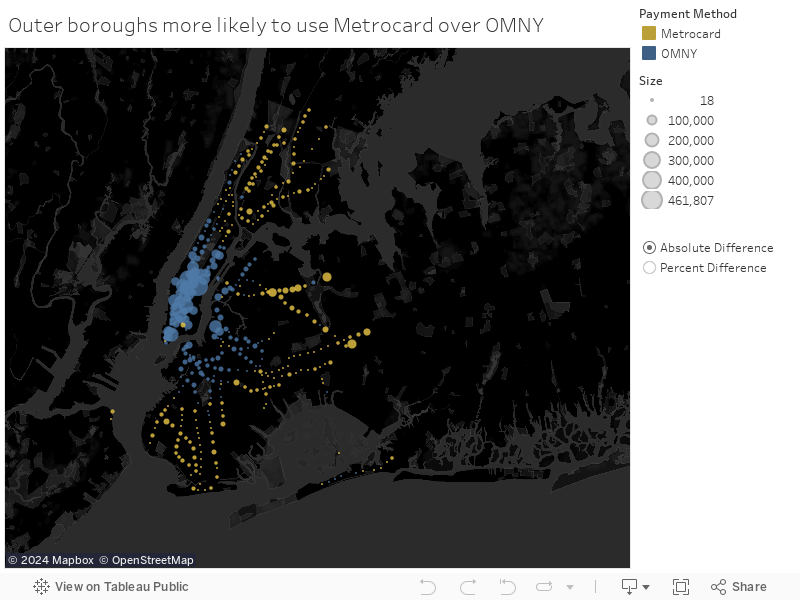
The map highlights a clear divide between OMNY and MetroCard usage across the boroughs. OMNY, New York City’s latest tap-to-pay system, is predominantly used in Manhattan and Brooklyn, while MetroCard remains the favored payment method in the outer boroughs of Queens, the Bronx, and Staten Island. This geographic distribution provides a visual representation of the technological adoption trends among different neighborhoods.
While this map demonstrates the prevalence of OMNY in Manhattan and Brooklyn, it doesn’t explain why. We can make guesses about what role socioeconomic and demographic factors play but we’ll need more data before making any conclusions.