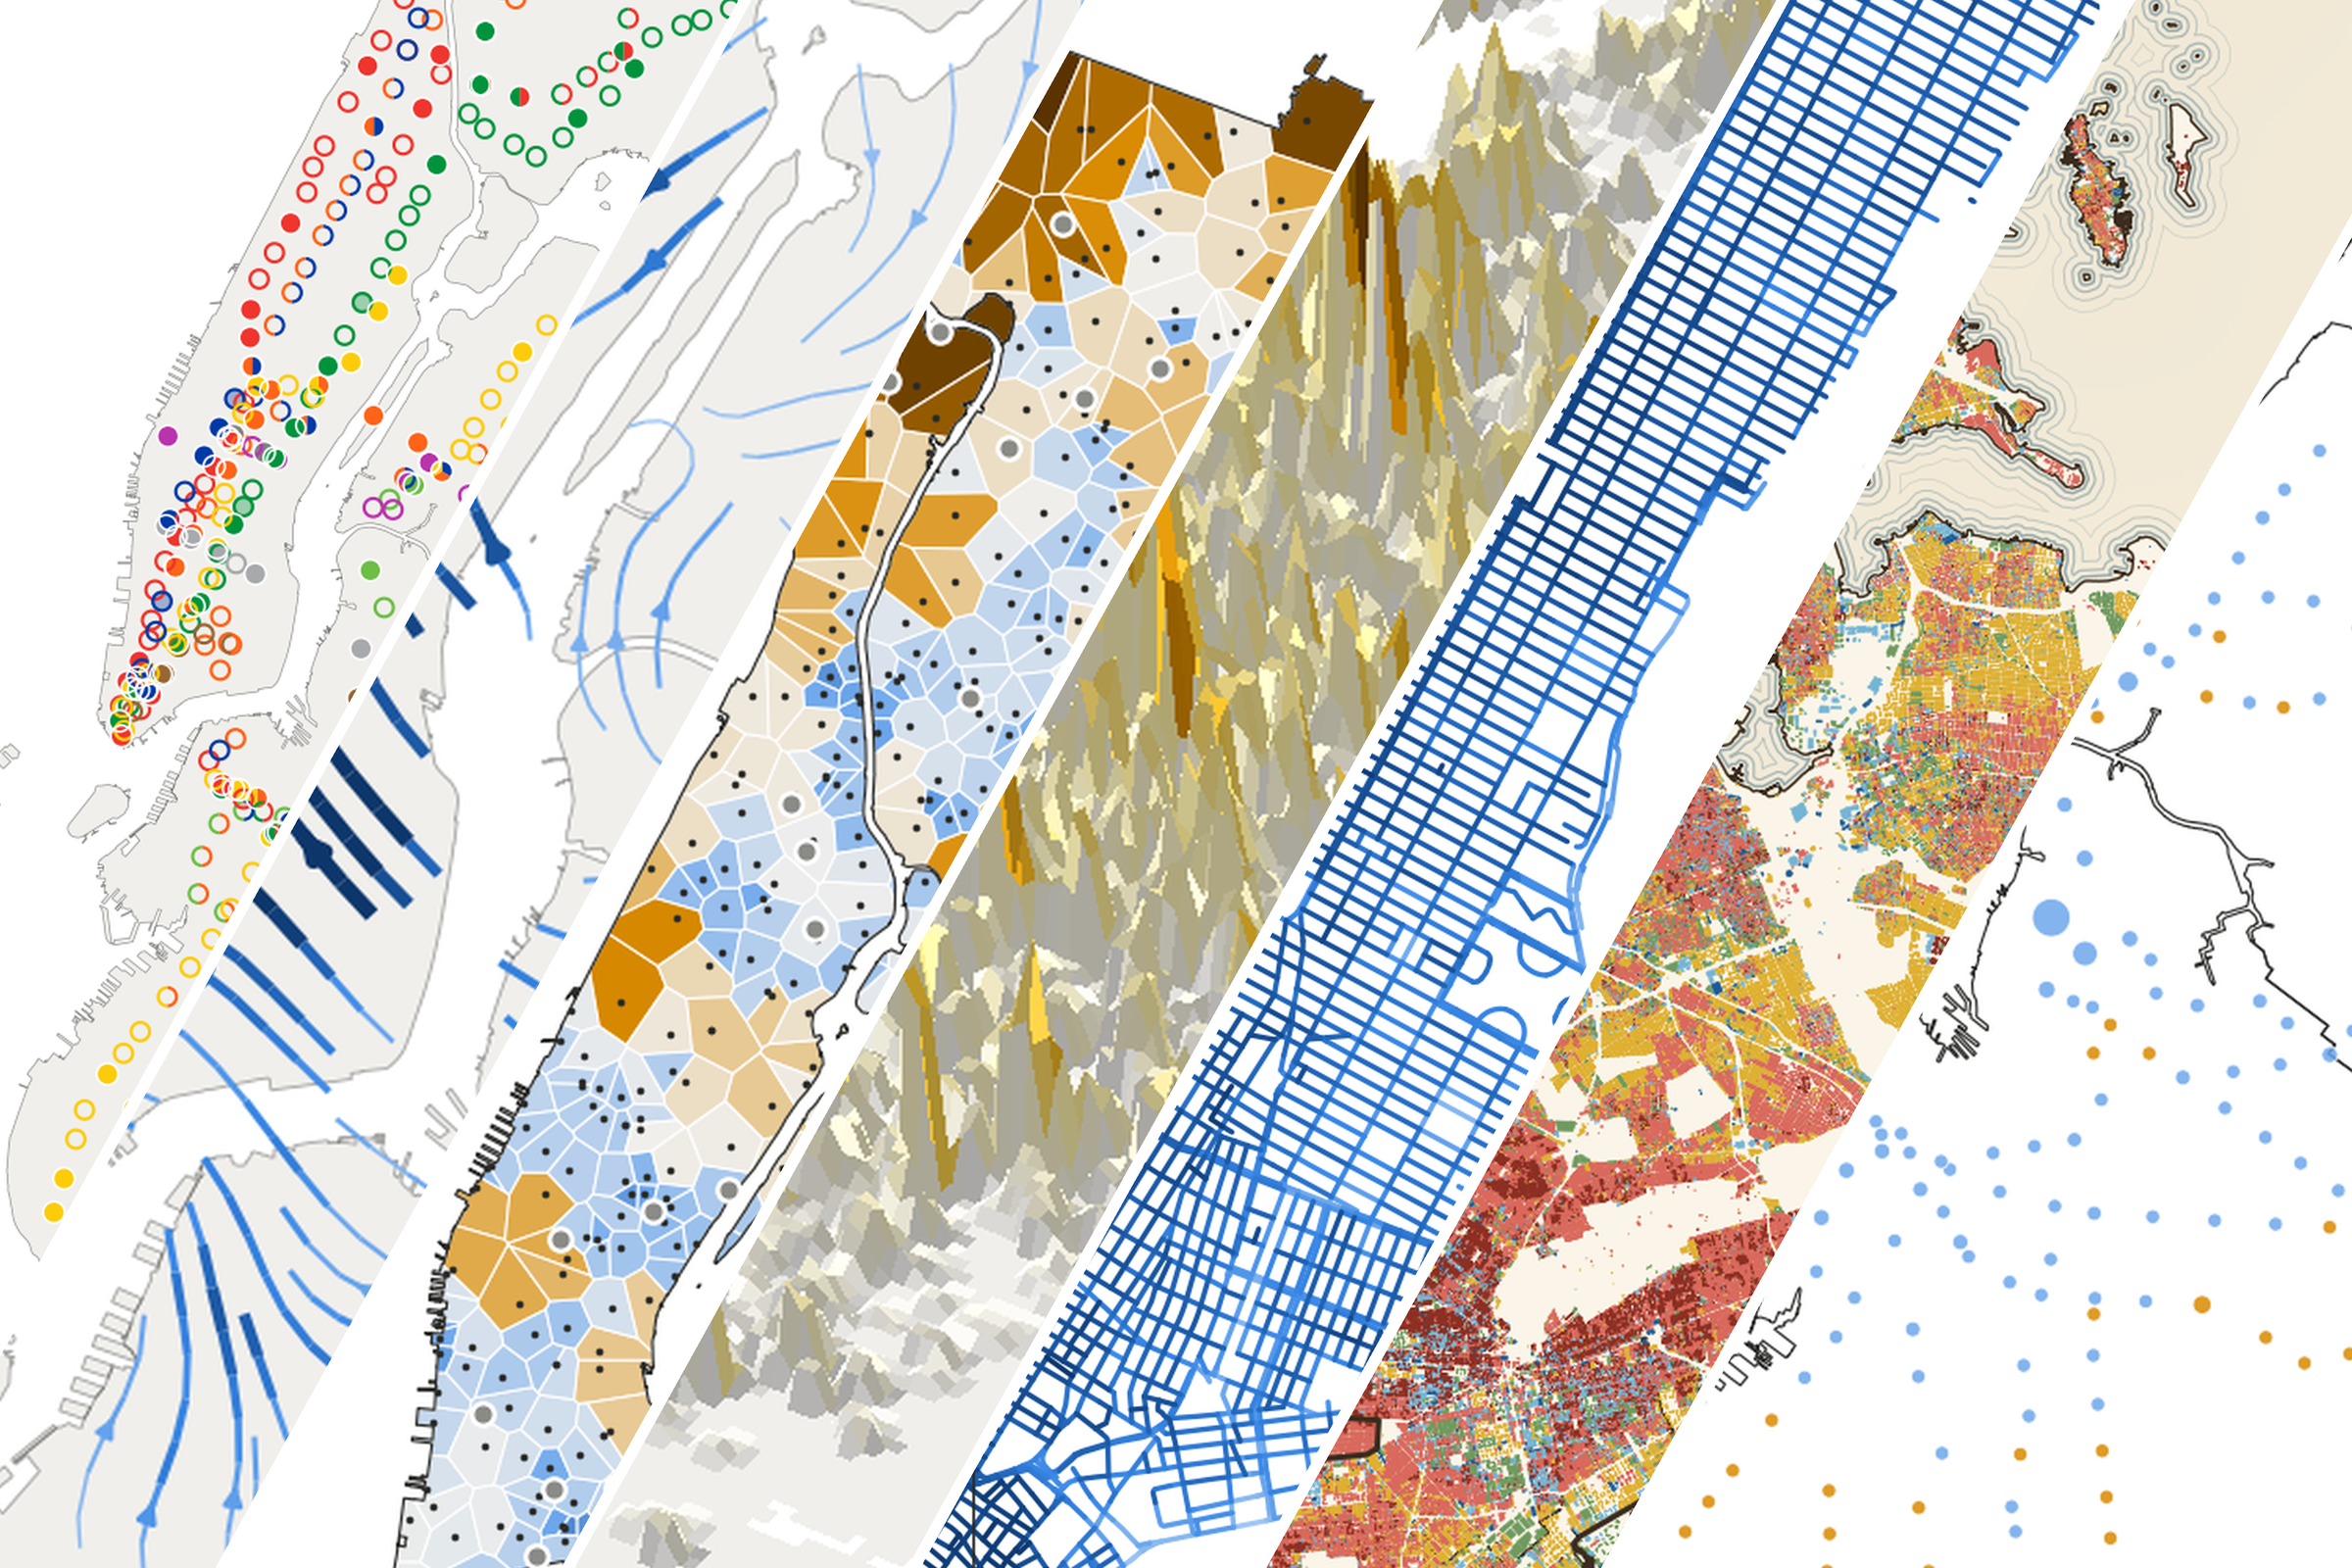
This November I'm taking part in the 30 Day Map Challenge: one map a day, each with its own prompt. The first week's prompts were Points, Lines, Polygons, Clusters, Senses: Sight, Vintage and 10 minute map.
All seven of my maps ended up being about New York City, using public data. Five are about getting around: subway stations, bike trips, bathrooms, crashes and fares. The other two are about what surrounds you here: the buildings and the sky between them.
Every map has a static image and an interactive version. Here's the week.
Day 1 · Points: Only a third of NYC subway stations can be used without stairs
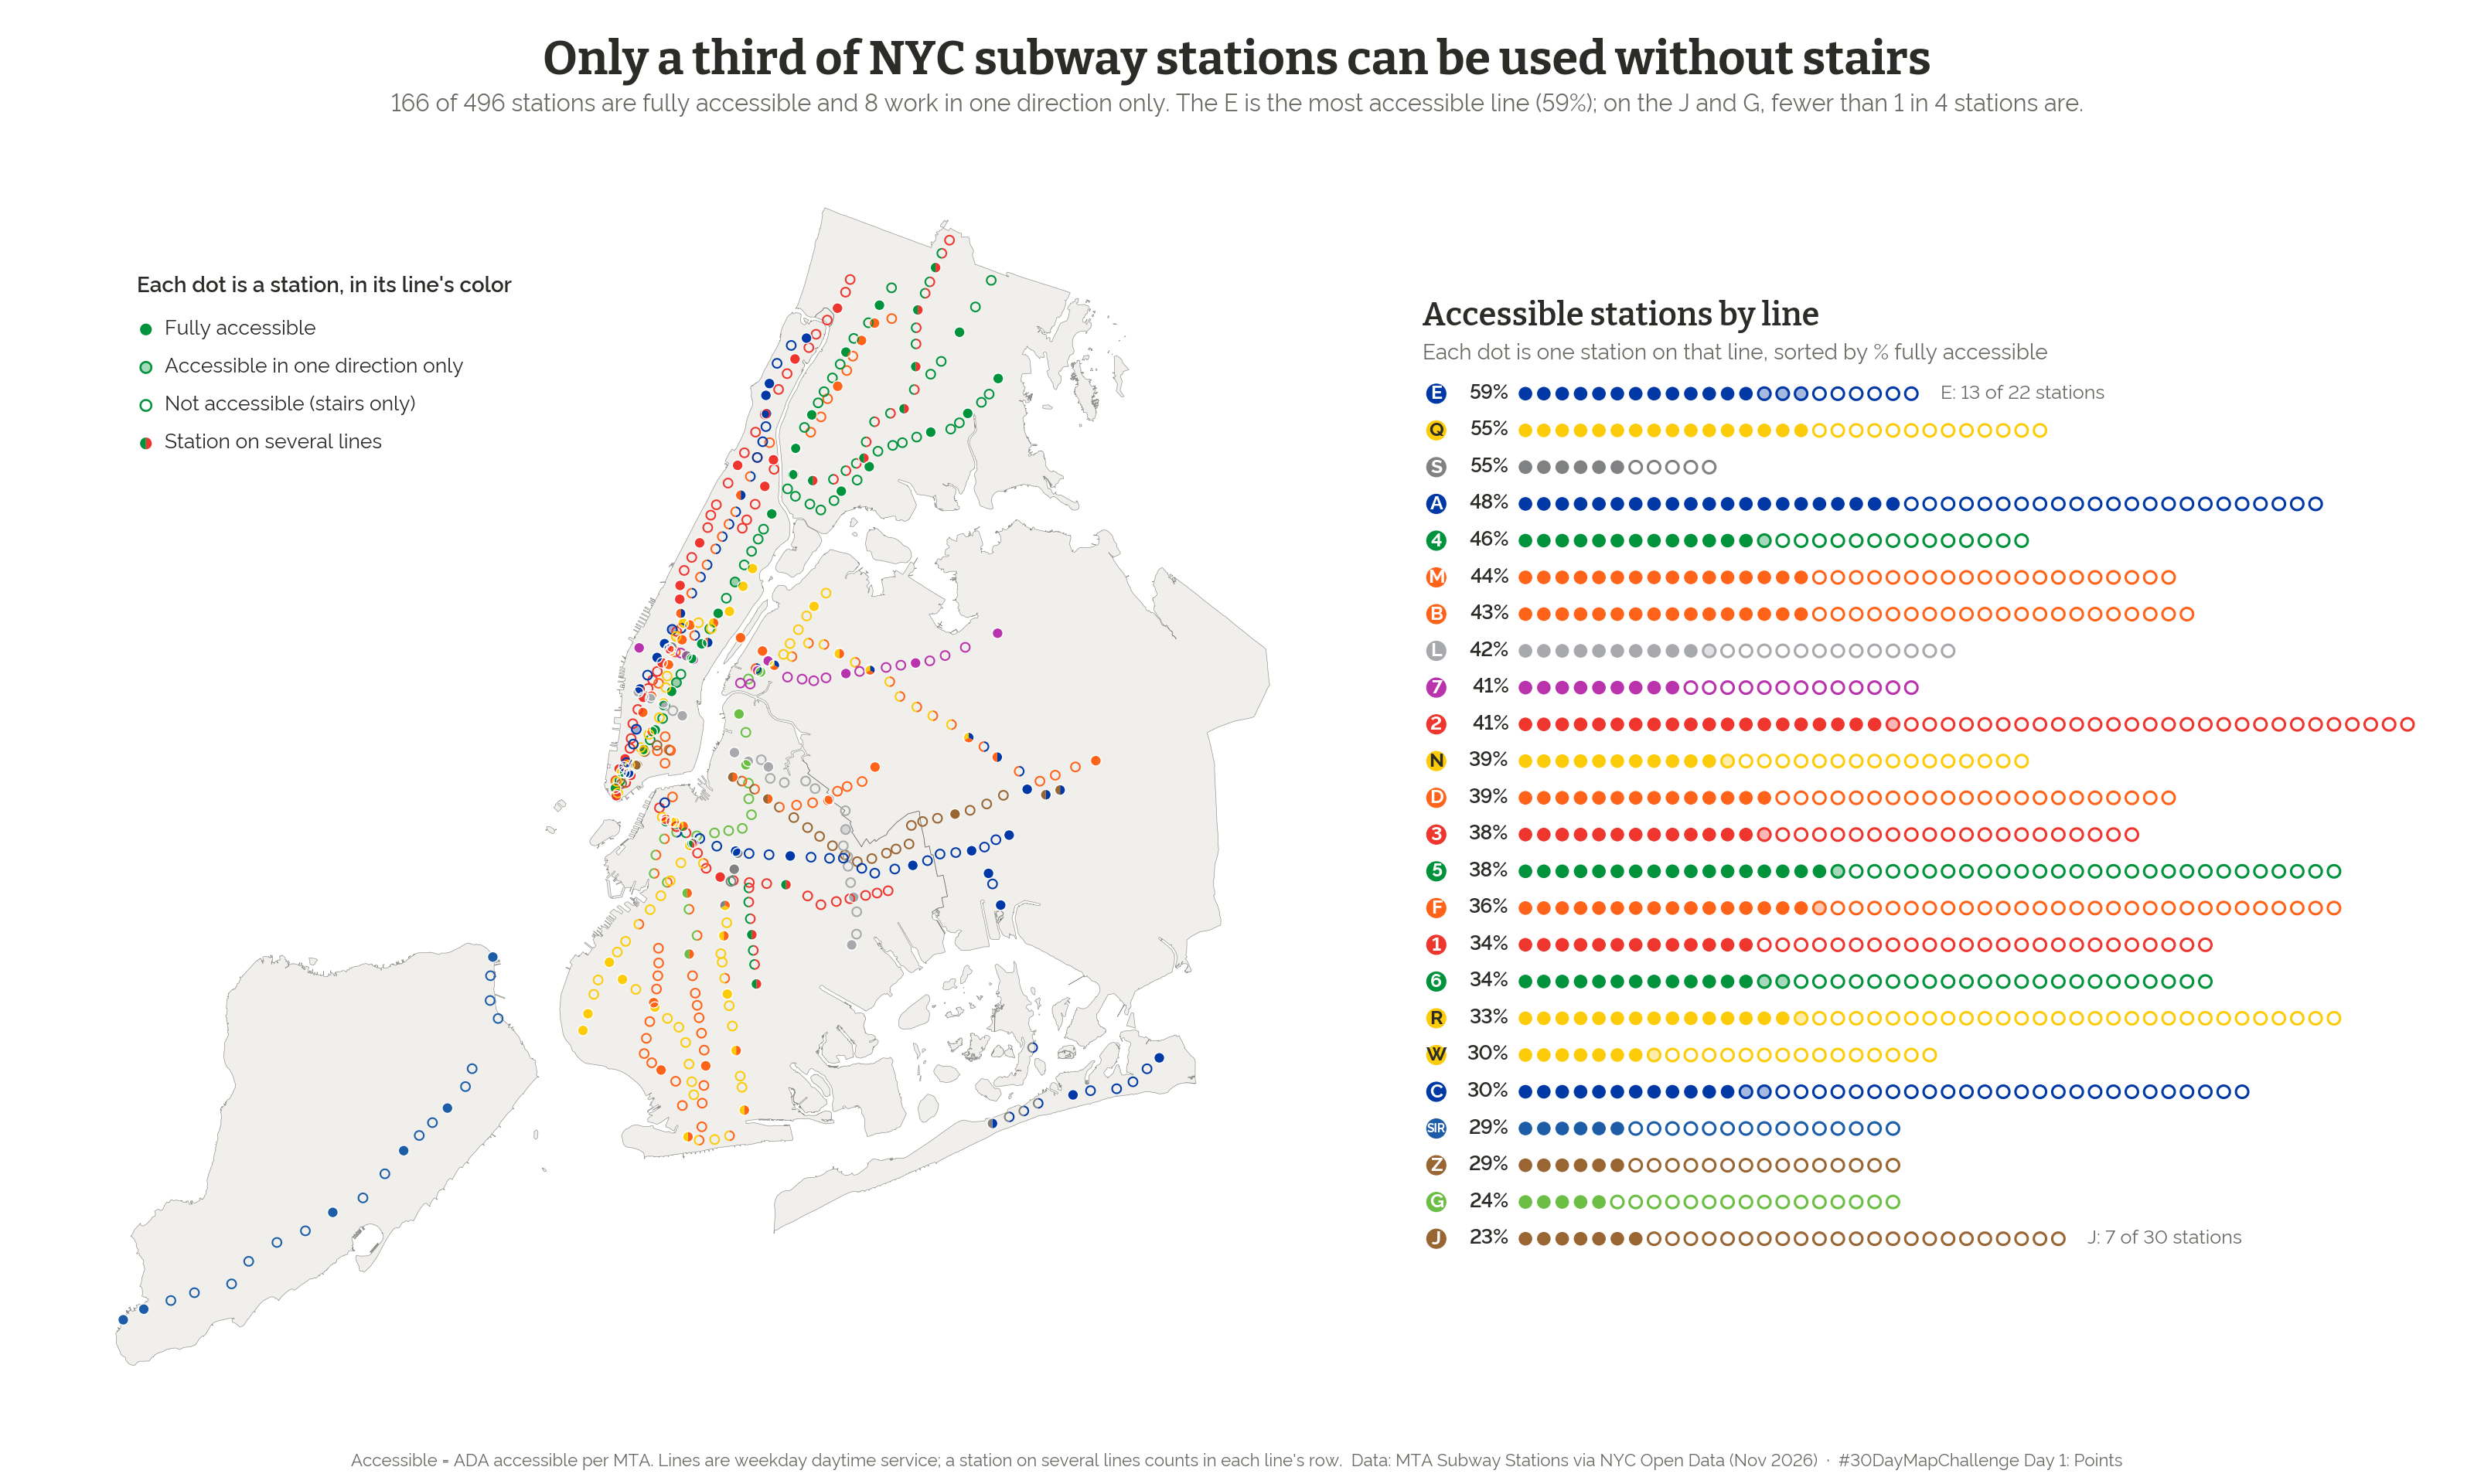
Each station is a dot in its line's color: filled if it's ADA accessible, a ring if it isn't. Of 496 stations, 166 are fully accessible, and another 8 are accessible in one direction only. It depends a lot on which line you ride: 59% of stations on the E are accessible, but fewer than 1 in 4 on the J and G.
Open the interactive map → · Data: MTA Subway Stations, via NYC Open Data
Day 2 · Lines: Every weekday, Citi Bike flows toward Midtown until about 2pm, then turns around
A wind map, but for bikes instead of air. I turned nearly 5 million trips from September 2026 into directions and let trips going opposite ways cancel out, so what's left is the net flow. Between 8 and 9am on an average weekday, about 143 more bikes arrive near Park Ave and E 42 St than leave. Weekends have the same shape at about 60% of the strength.
Open the interactive map → · Data: Citi Bike System Data
Day 3 · Polygons: On average, the nearest public bathroom in NYC is an 11-minute walk
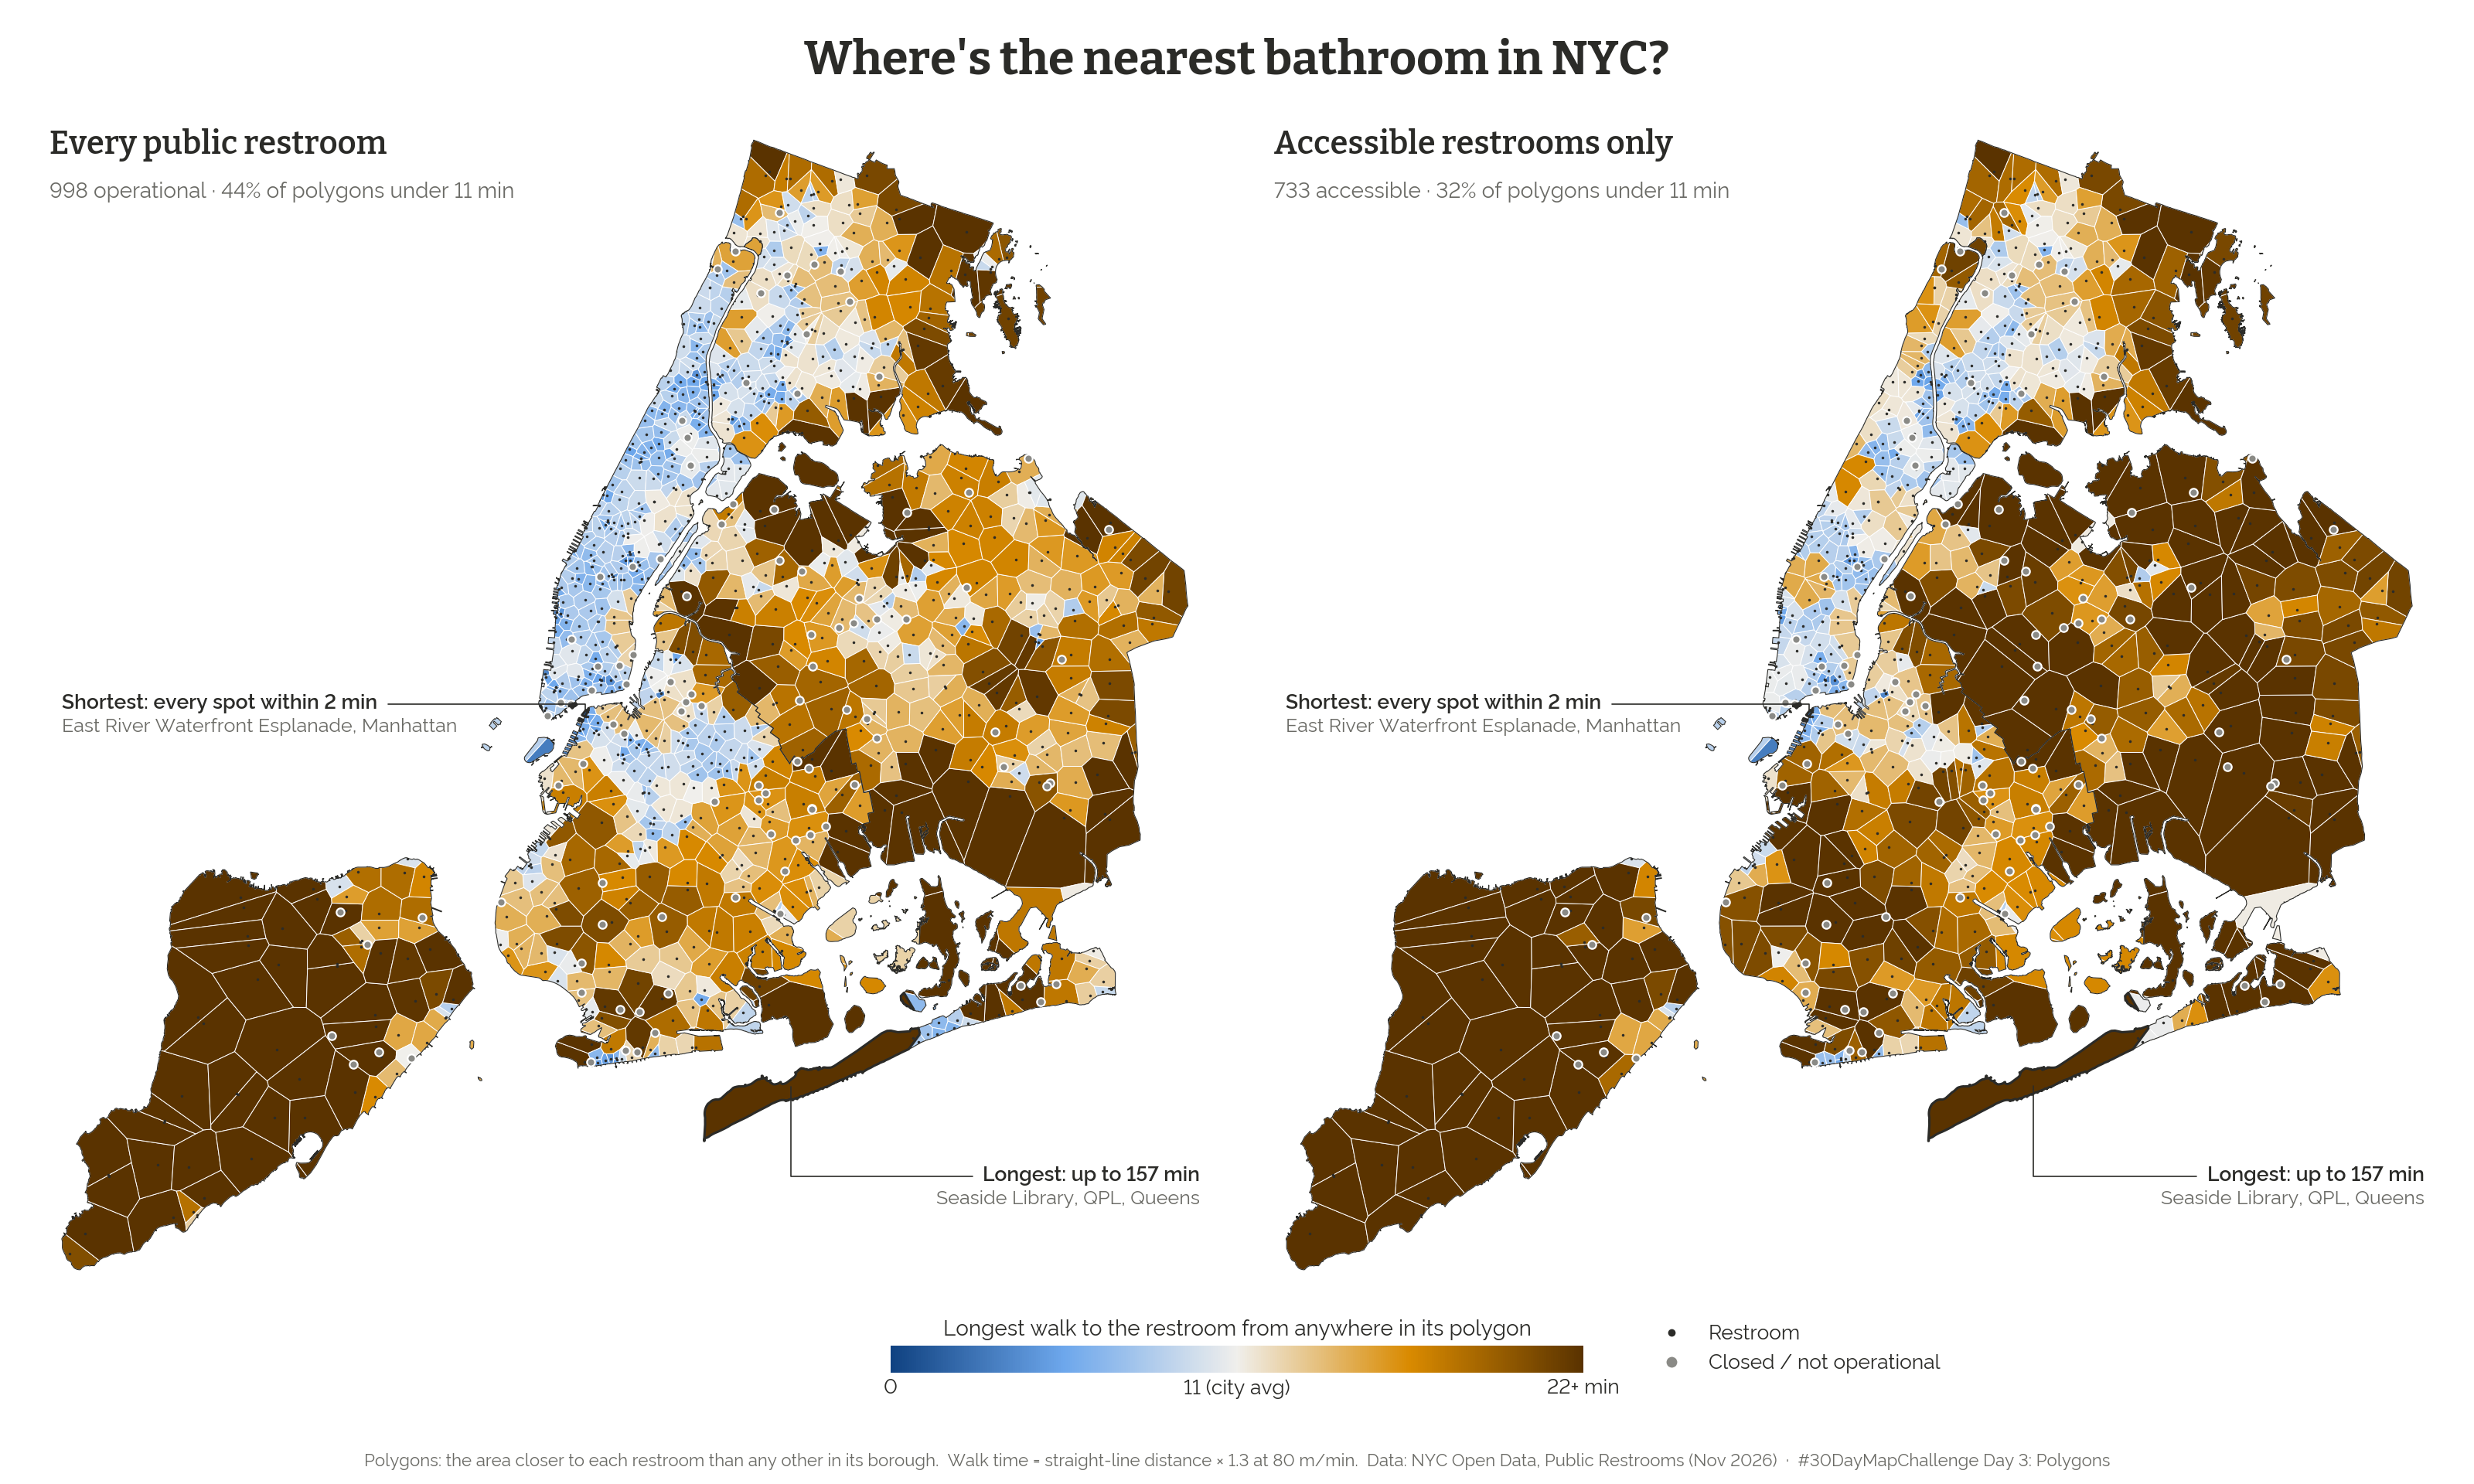
Each polygon is the area closest to one public restroom, colored by the longest walk from anywhere inside it. The citywide average rises from 10.9 to 12.5 minutes if you only count accessible restrooms. Borough matters too: the typical polygon tops out at about 8 minutes in Manhattan and about 25 on Staten Island. Walk times are estimates, based on straight-line distance with an allowance for street detours.
Open the interactive map → · Data: Public Restrooms, NYC Open Data
Day 4 · Clusters: NYC's three tallest crash peaks
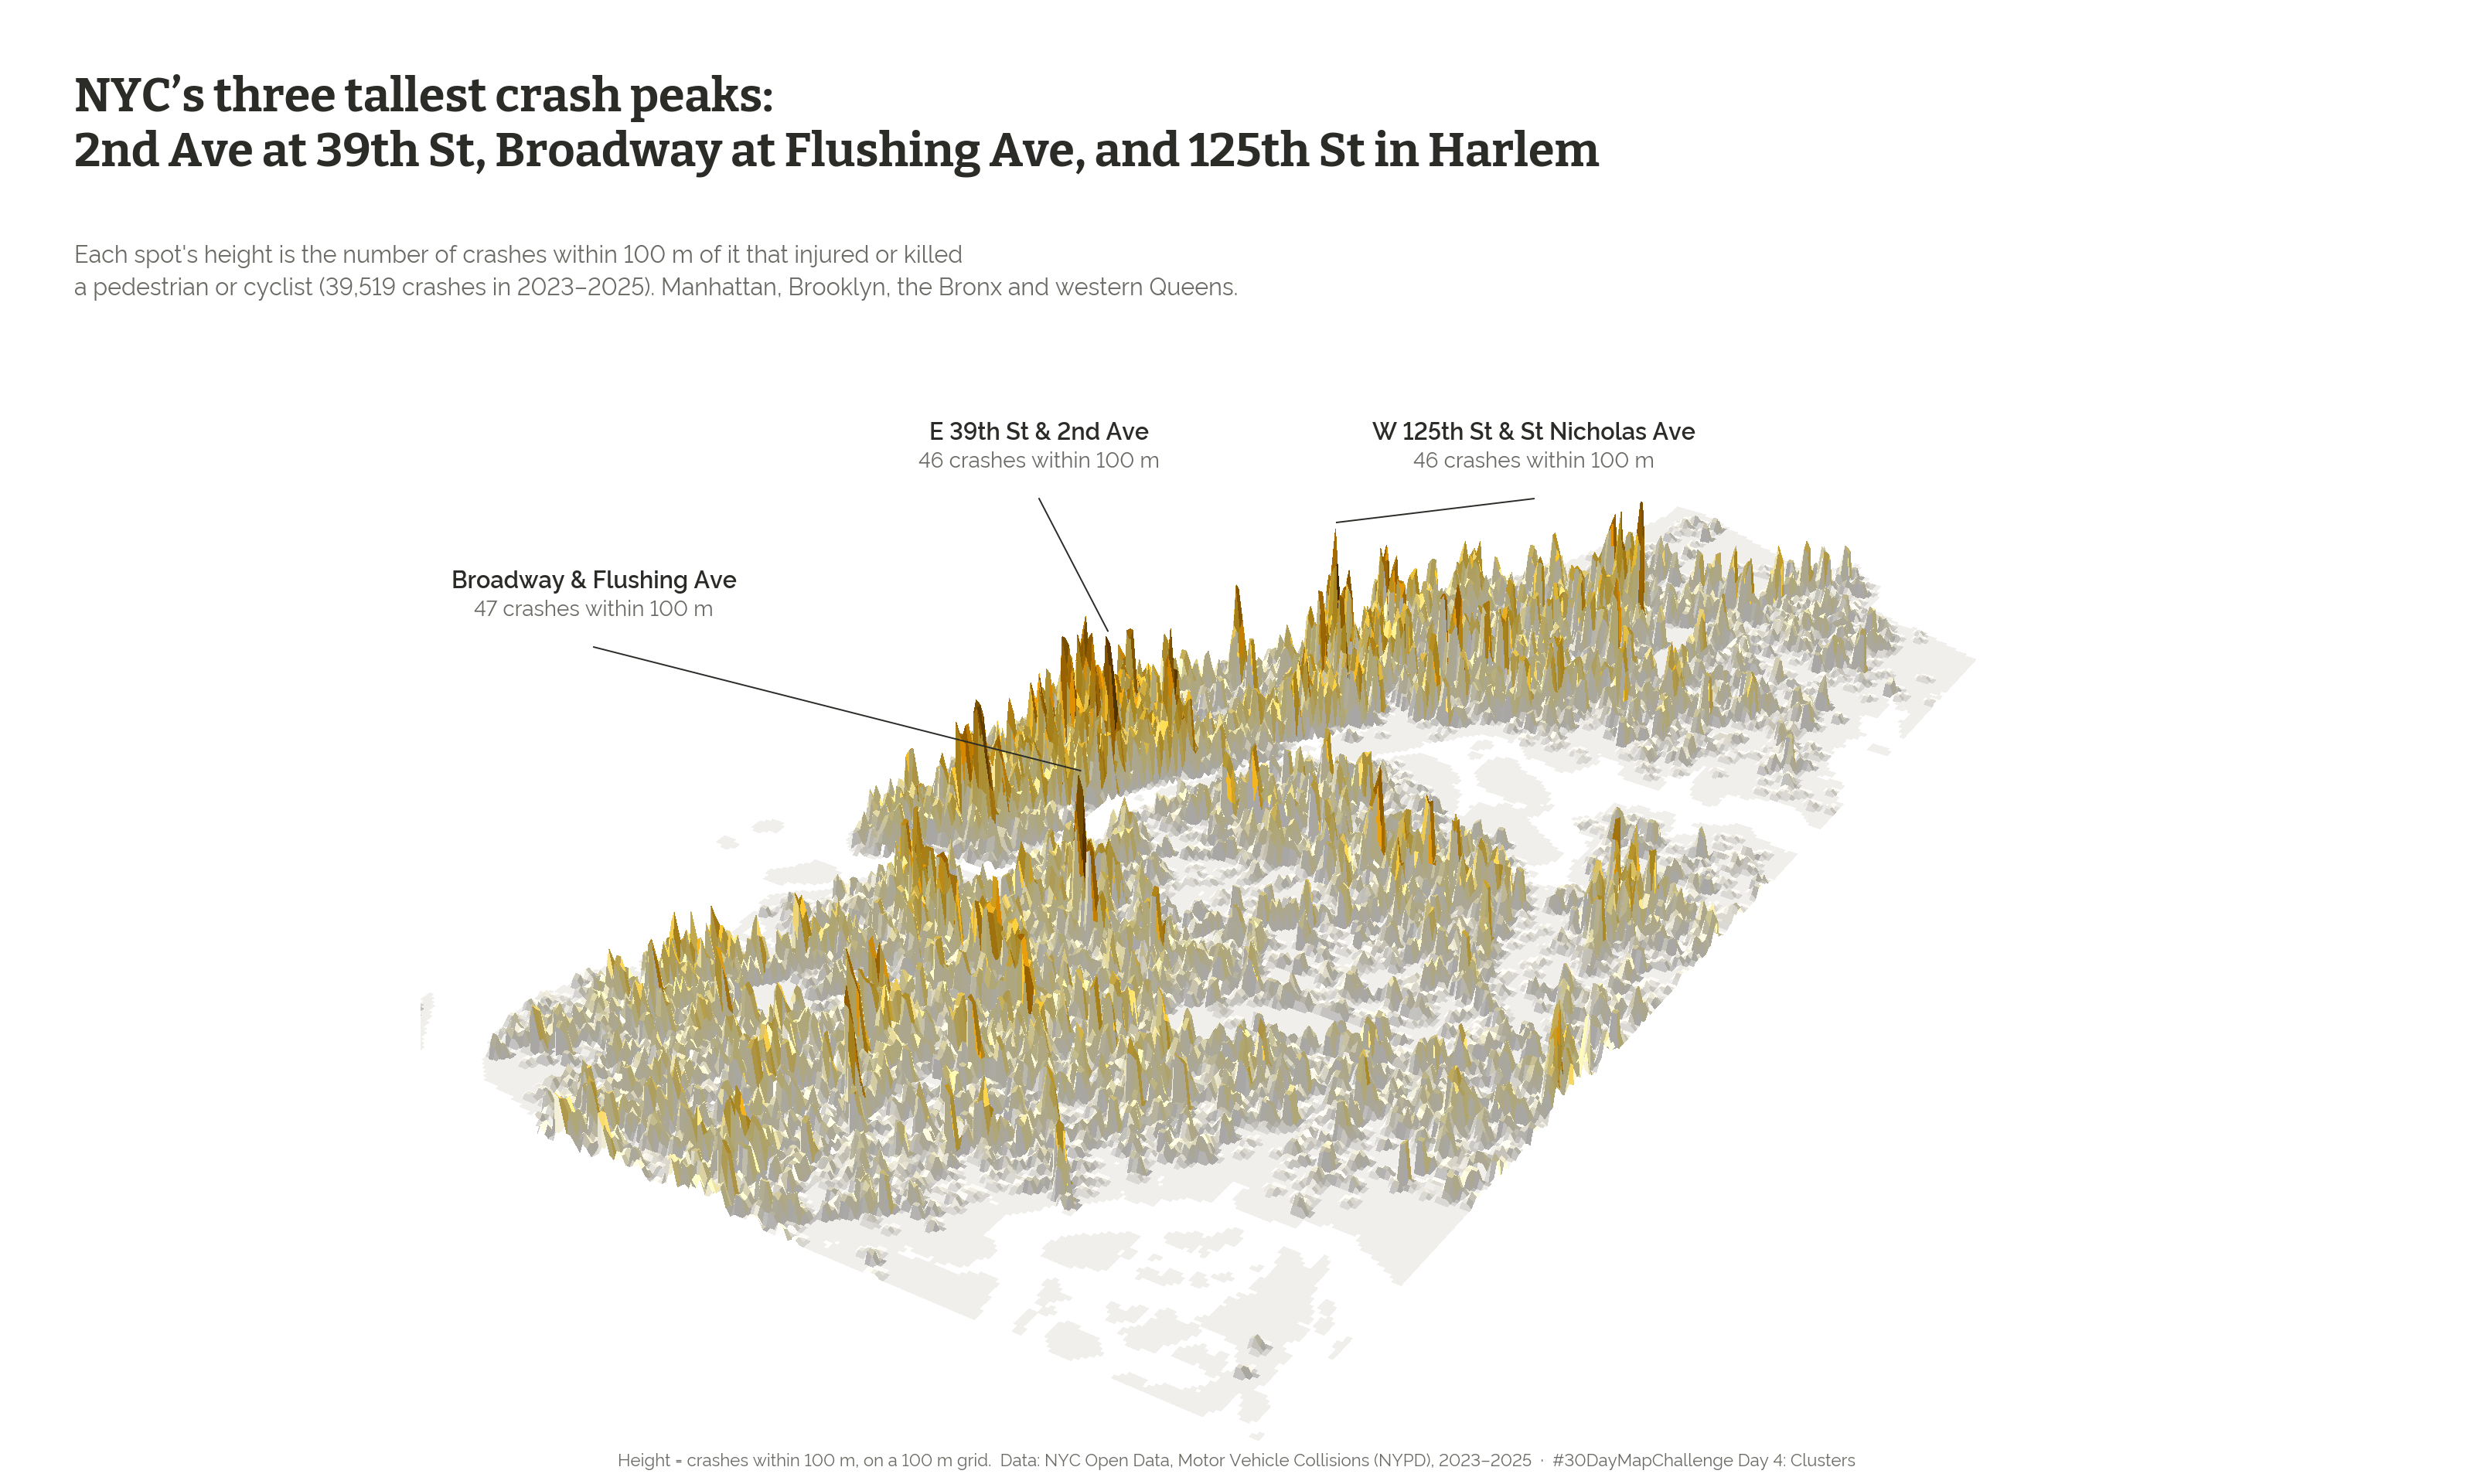
This one turns crashes into terrain. It covers 2023–2025 crashes that injured or killed a pedestrian or cyclist, and the height at each spot is the number of crashes within 100 meters. The three tallest peaks are at Broadway and Flushing Ave in Brooklyn (47), 2nd Ave and E 39th St (46), and W 125th St and St Nicholas Ave (46). You can drag to turn the city and hover to find the nearest intersection.
Open the interactive map → · Data: Motor Vehicle Collisions (NYPD), NYC Open Data
Day 5 · Senses: Sight: On Wall Street you can see 6% of the sky. On a typical Staten Island block, 83%.
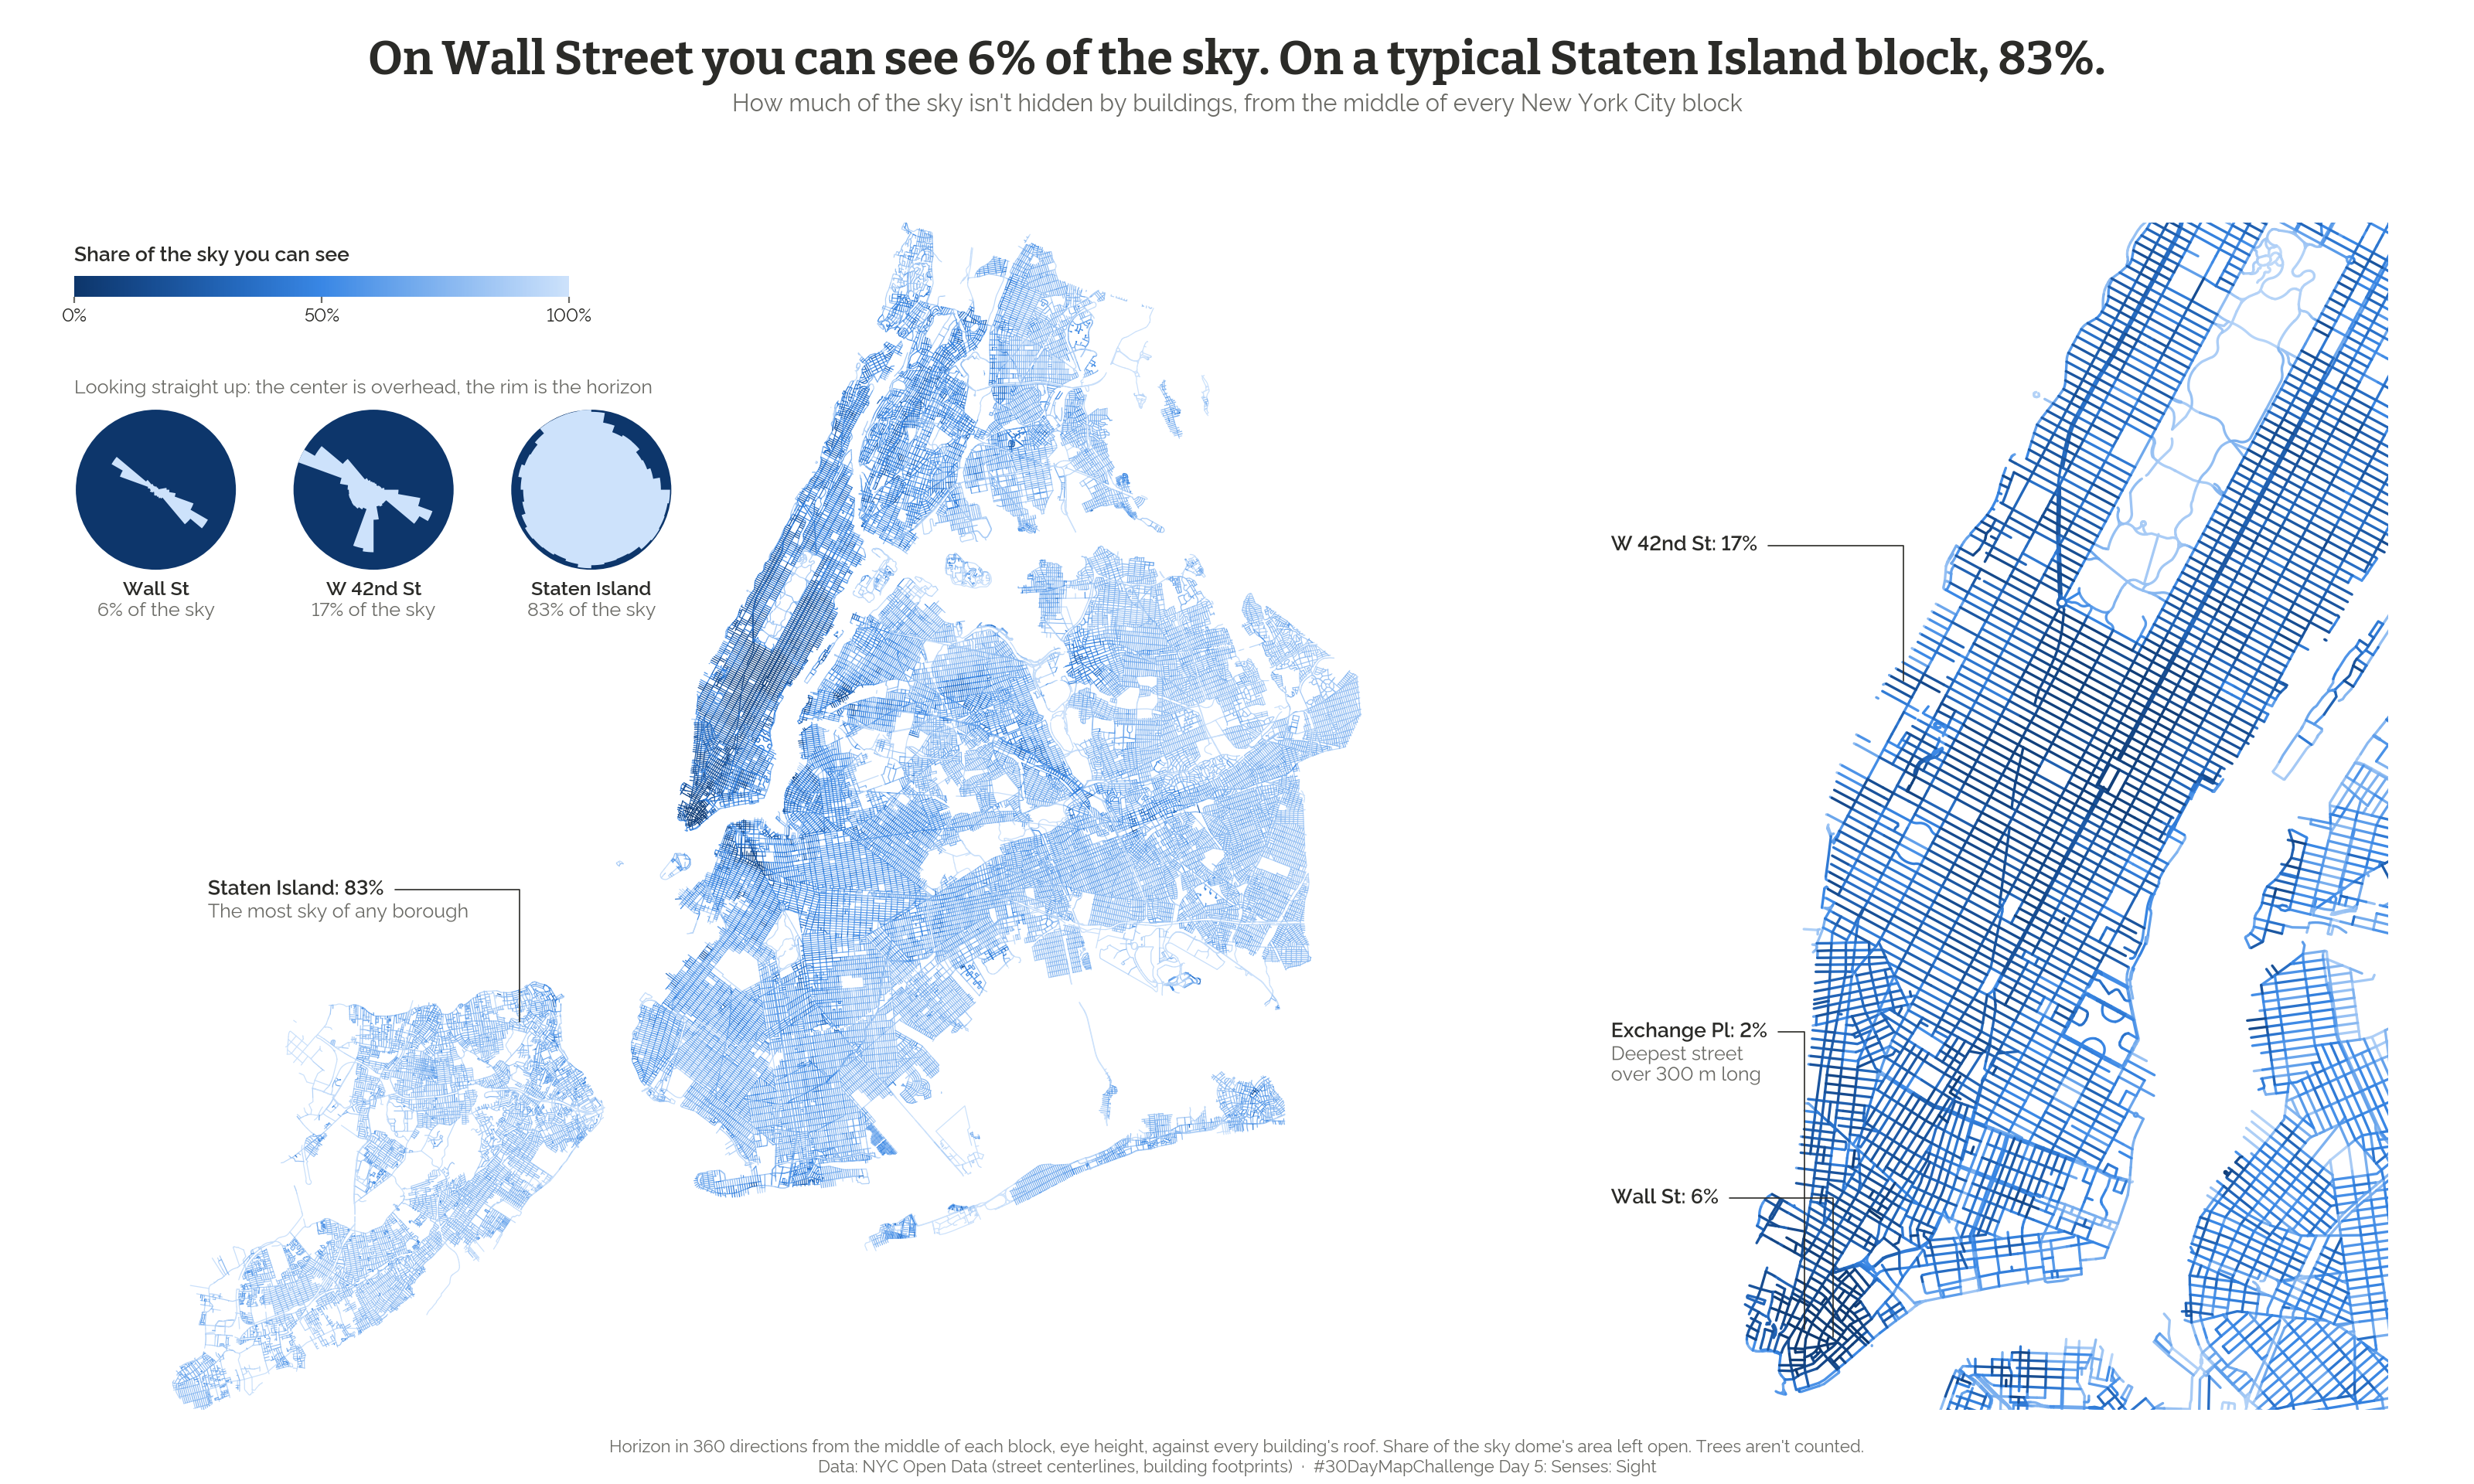
From the middle of each of about 104,000 blocks, how much of the sky isn't hidden by buildings? The deepest Financial District canyons get about 2%. Hover or tap any block to see its sky circle, the view straight up from that spot. Trees aren't counted, so leafy blocks look more open here than they feel in July.
Open the interactive map → · Data: street centerlines and building footprints, NYC Open Data
Day 6 · Vintage: How old is your neighborhood?
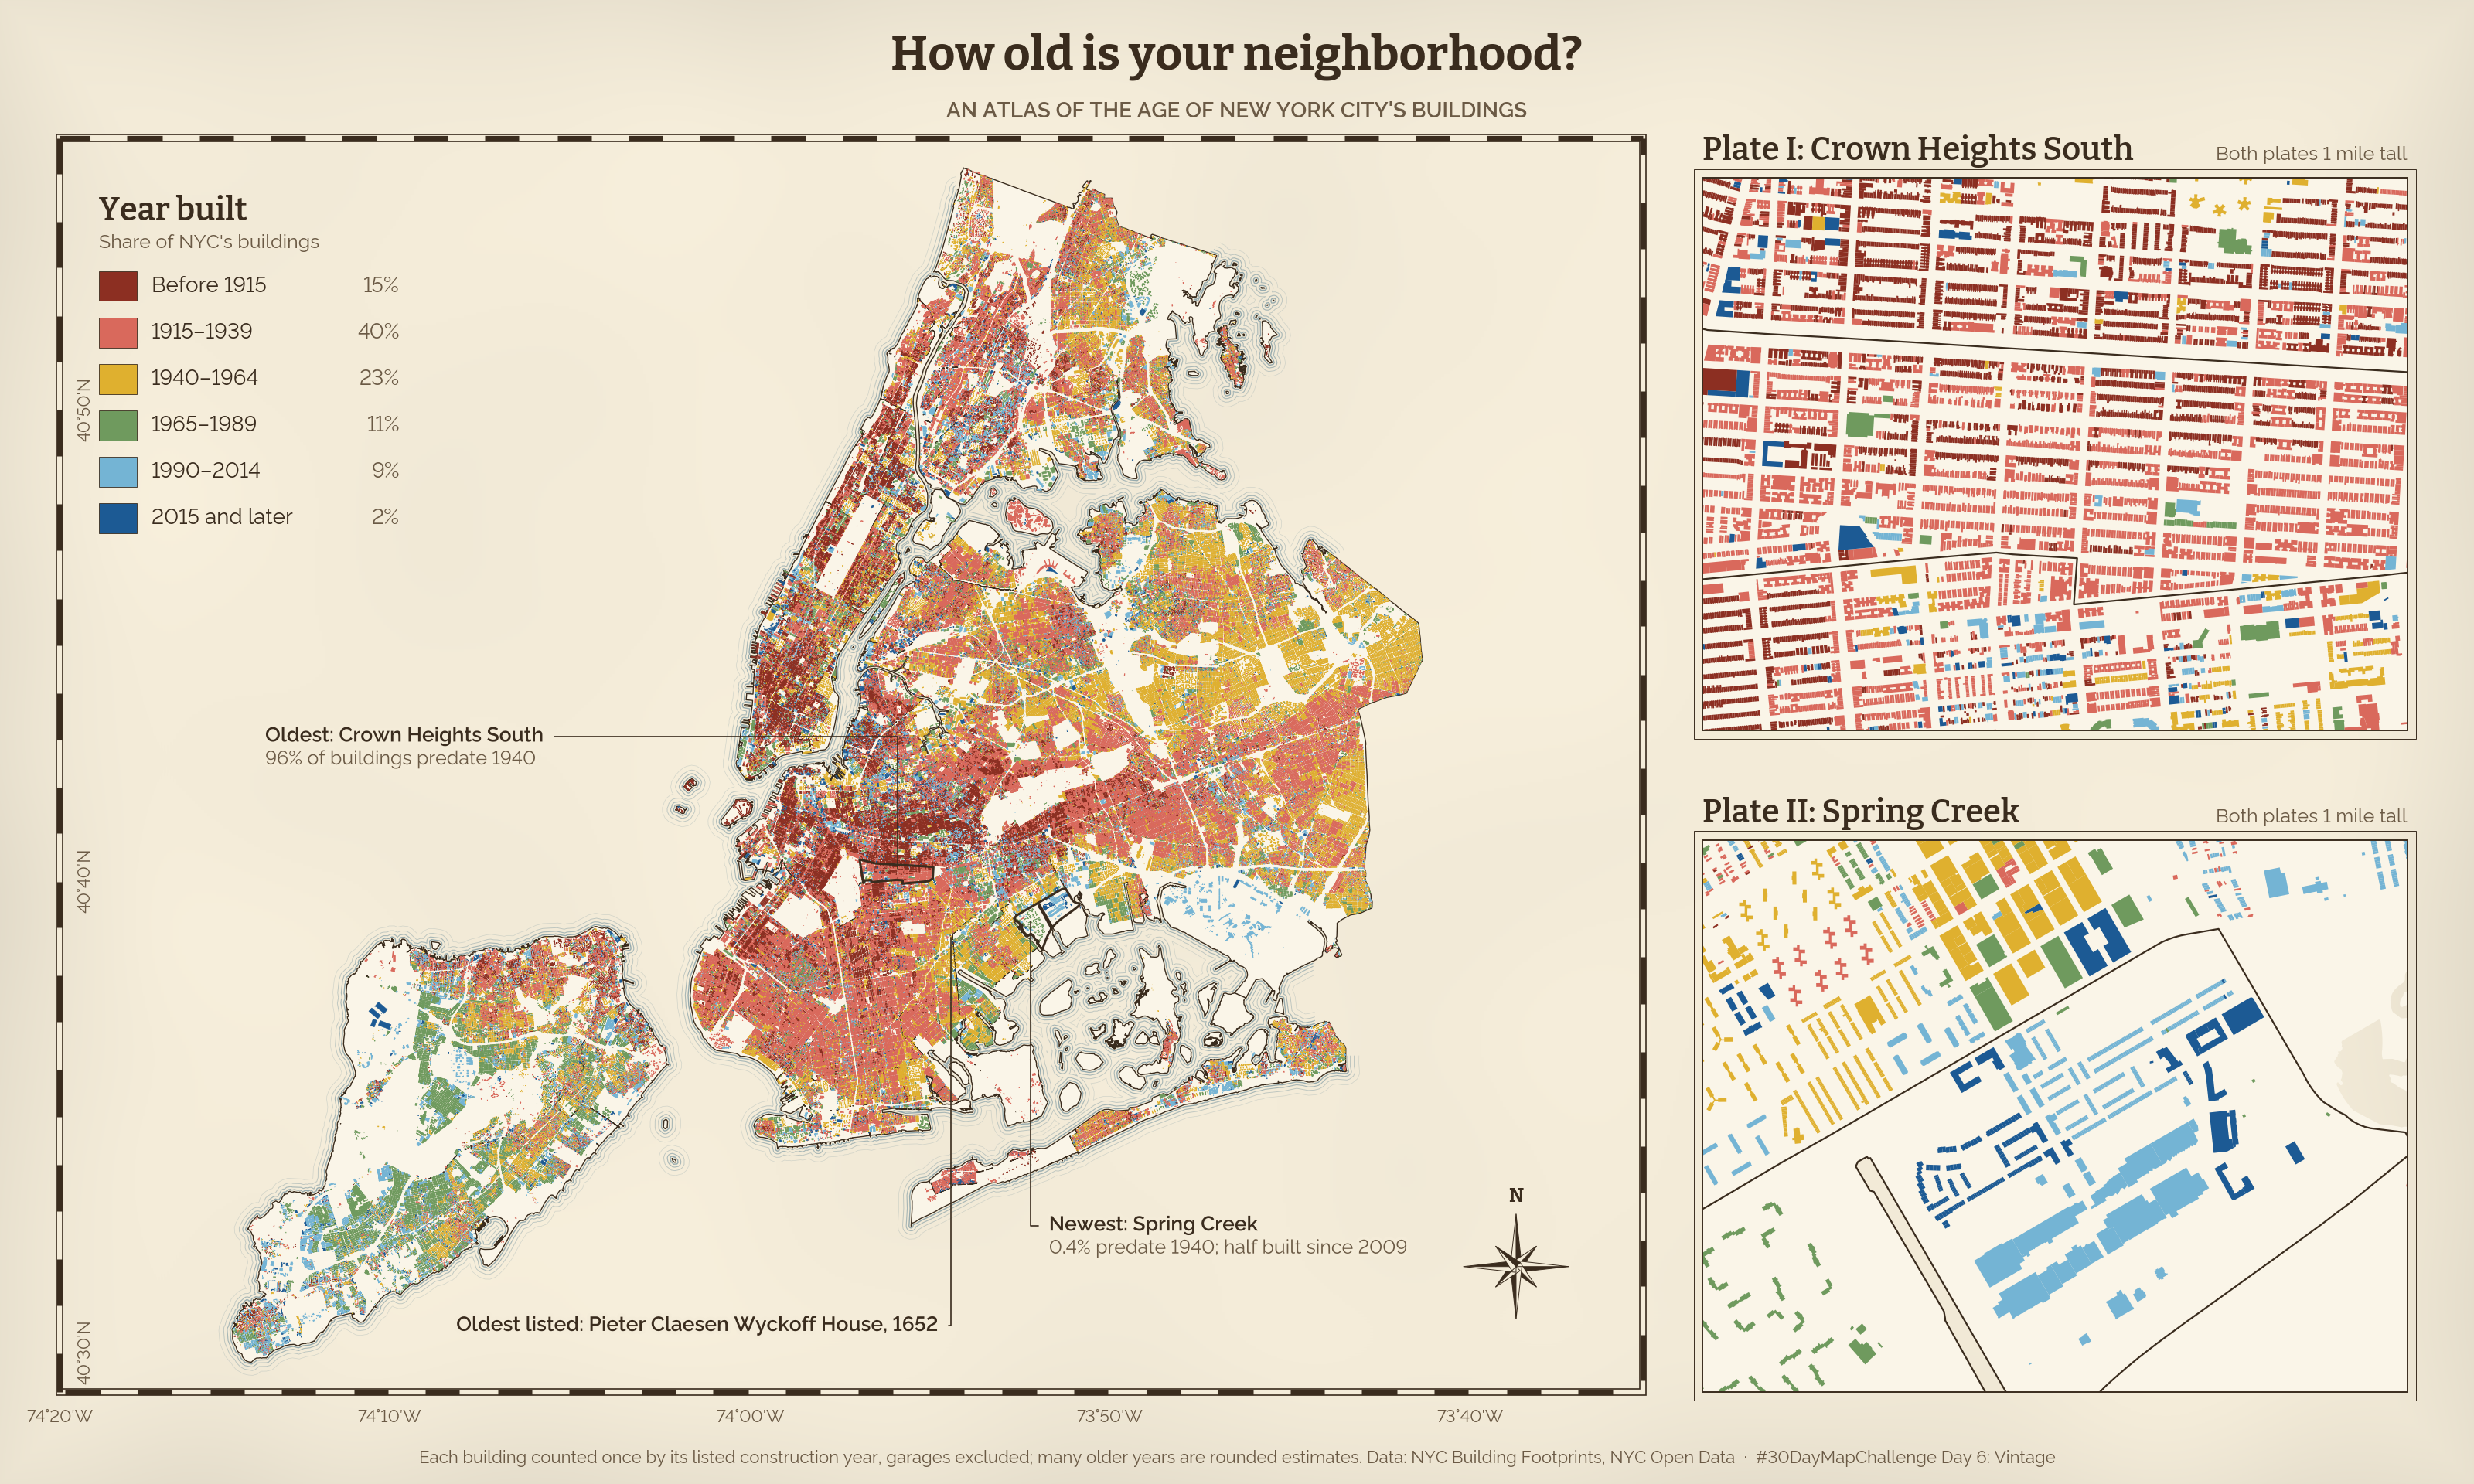
All 862,360 buildings, colored by the year they went up and drawn like an old fire insurance atlas. In Crown Heights South, 96% of buildings predate 1940. In Spring Creek-Starrett City, 0.4% do. What surprised me is that the oldest neighborhood isn't anywhere near where the city began. Old neighborhoods aren't necessarily the first ones built. They're the ones where the buildings survived.
Open the interactive map → · Data: NYC Building Footprints, NYC Open Data
Day 7 · 10 minute map: MetroCard sales ended in 2025. See how OMNY adoption changed across the city.
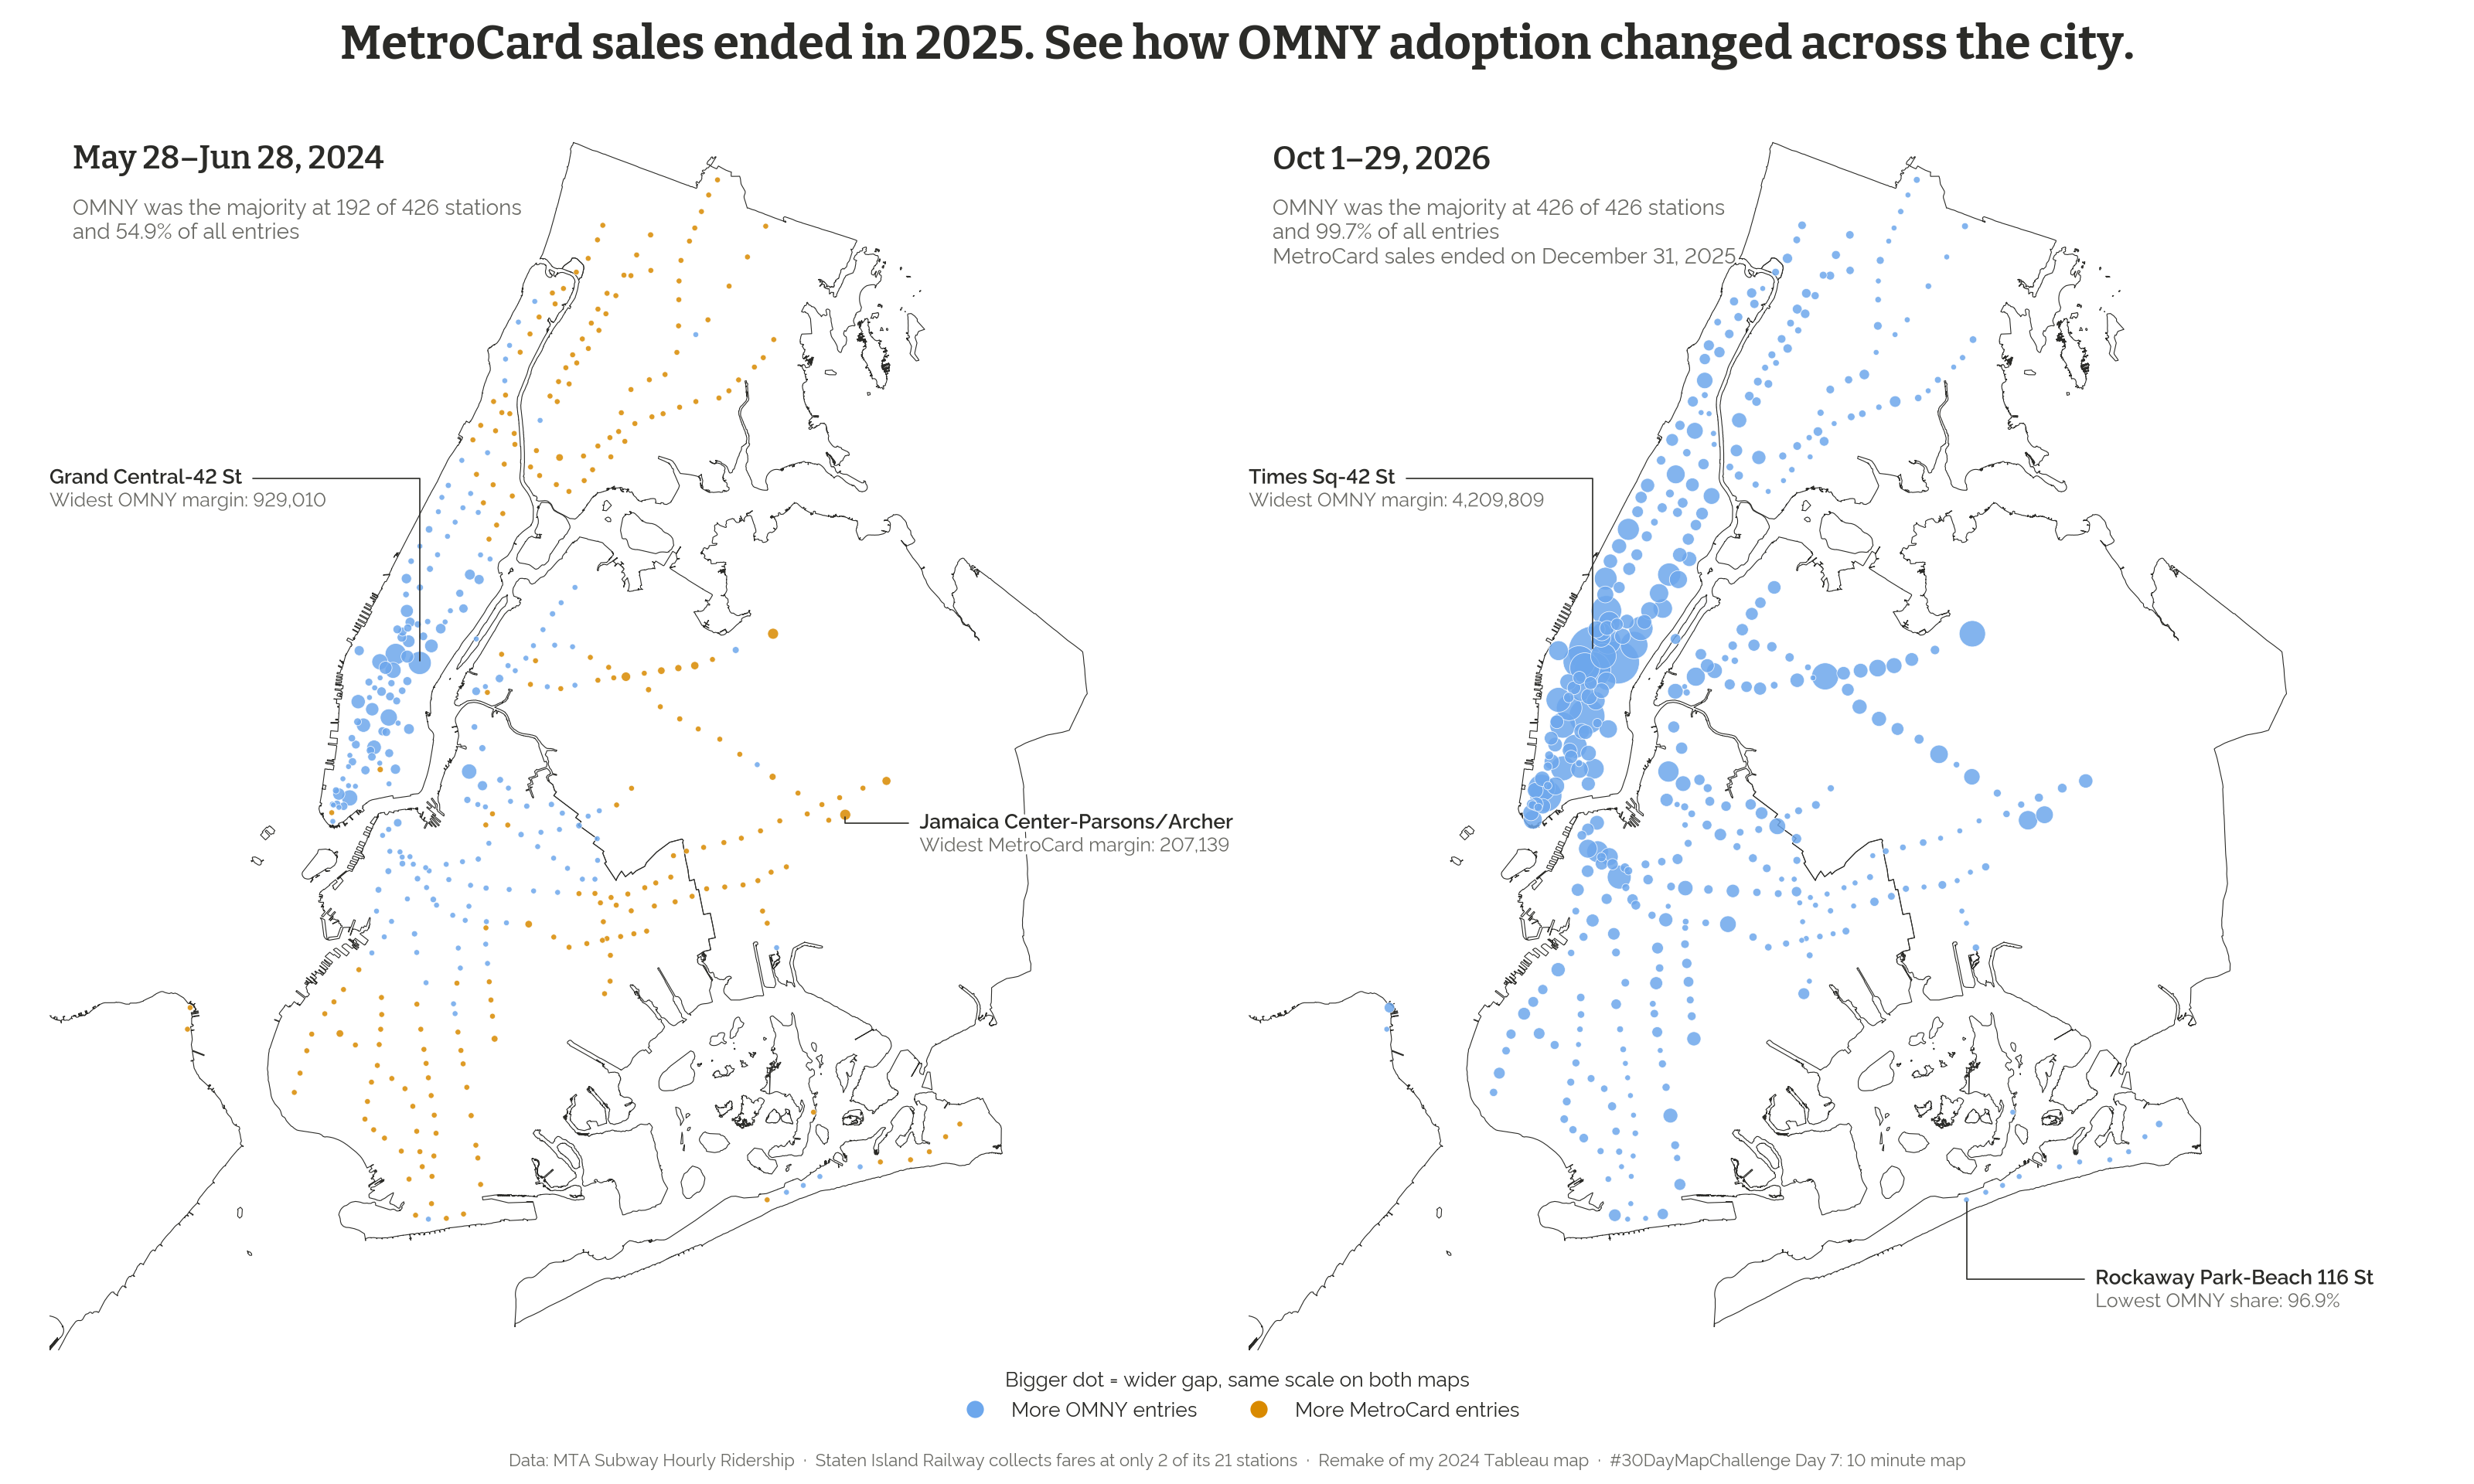
The prompt said 10 minutes. This did not take 10 minutes. I remade a map I first built in Tableau in 2024 and added the latest data. In mid-2024, OMNY made up 54.9% of entries and was the majority at 192 of 426 stations. By October 2026, it was 99.7% of entries and the majority at all of them. Since new MetroCards are no longer sold, that doesn't show that riders simply prefer OMNY. Much of the shift came early, though: OMNY's share was already 89% in October 2025, before sales ended.
Open the interactive map → · Data: MTA Subway Hourly Ridership
What I learned this week
The first form usually isn't the final one. The Citi Bike map started as arrows and became a wind map. The crash map started as flat hotspots and became terrain. The sky map started as a street henge map. Seeing an early version is often what showed me the better one.
Writing the headline is part of the analysis. I want each headline to state a finding and be literally true for the measure on the map. Day 7 is the clearest example. My first framing was about OMNY dominating, which isn't interesting once the MetroCard has been retired. The real story was adoption.
The caveats are often the most interesting part of the data. On Day 6, 69% of the listed construction years end in 0 or 5, and 89,005 buildings are listed as built in exactly 1920. Those are almost certainly estimates. On Day 7, Staten Island shows only 2 stations because its railway collects fares at just 2 of its 21 stops. Details like these explain how the data gets made, which changes what a map can honestly say.
A shared style pays off quickly. I set up the colors, fonts and controls at the start, so each new day could focus on the data and the question while the series still looks like one project.
Next up: week 2, starting with Utopia.
All maps: daniellecarrick.github.io/30-day-map-challenge · Code: GitHub · Prompts: 30daymapchallenge.com
#30DayMapChallenge