
Data Viz Design System for The Trade Desk
Turned an inconsistent set of charts into a shared, accessible visual language for a leading ad-tech platform.
Role: Data Viz Design System Lead (contract)
Client: The Trade Desk, the leading independent demand-side platform (DSP)
Scope: Audit, visual standards, reusable components, team training
The problem
The Trade Desk had a robust UX design system for buttons, typography, and layouts, but nothing for data visualization. Yet charts and dashboards are where its customers make their most important decisions. Across the platform, teams treated axes, legends, and labels differently, and colors didn't carry consistent meaning.
My role
I led the work end to end: auditing every chart on the platform, defining visual standards, building the first reusable components, and running workshops to drive adoption across design and engineering.
The approach
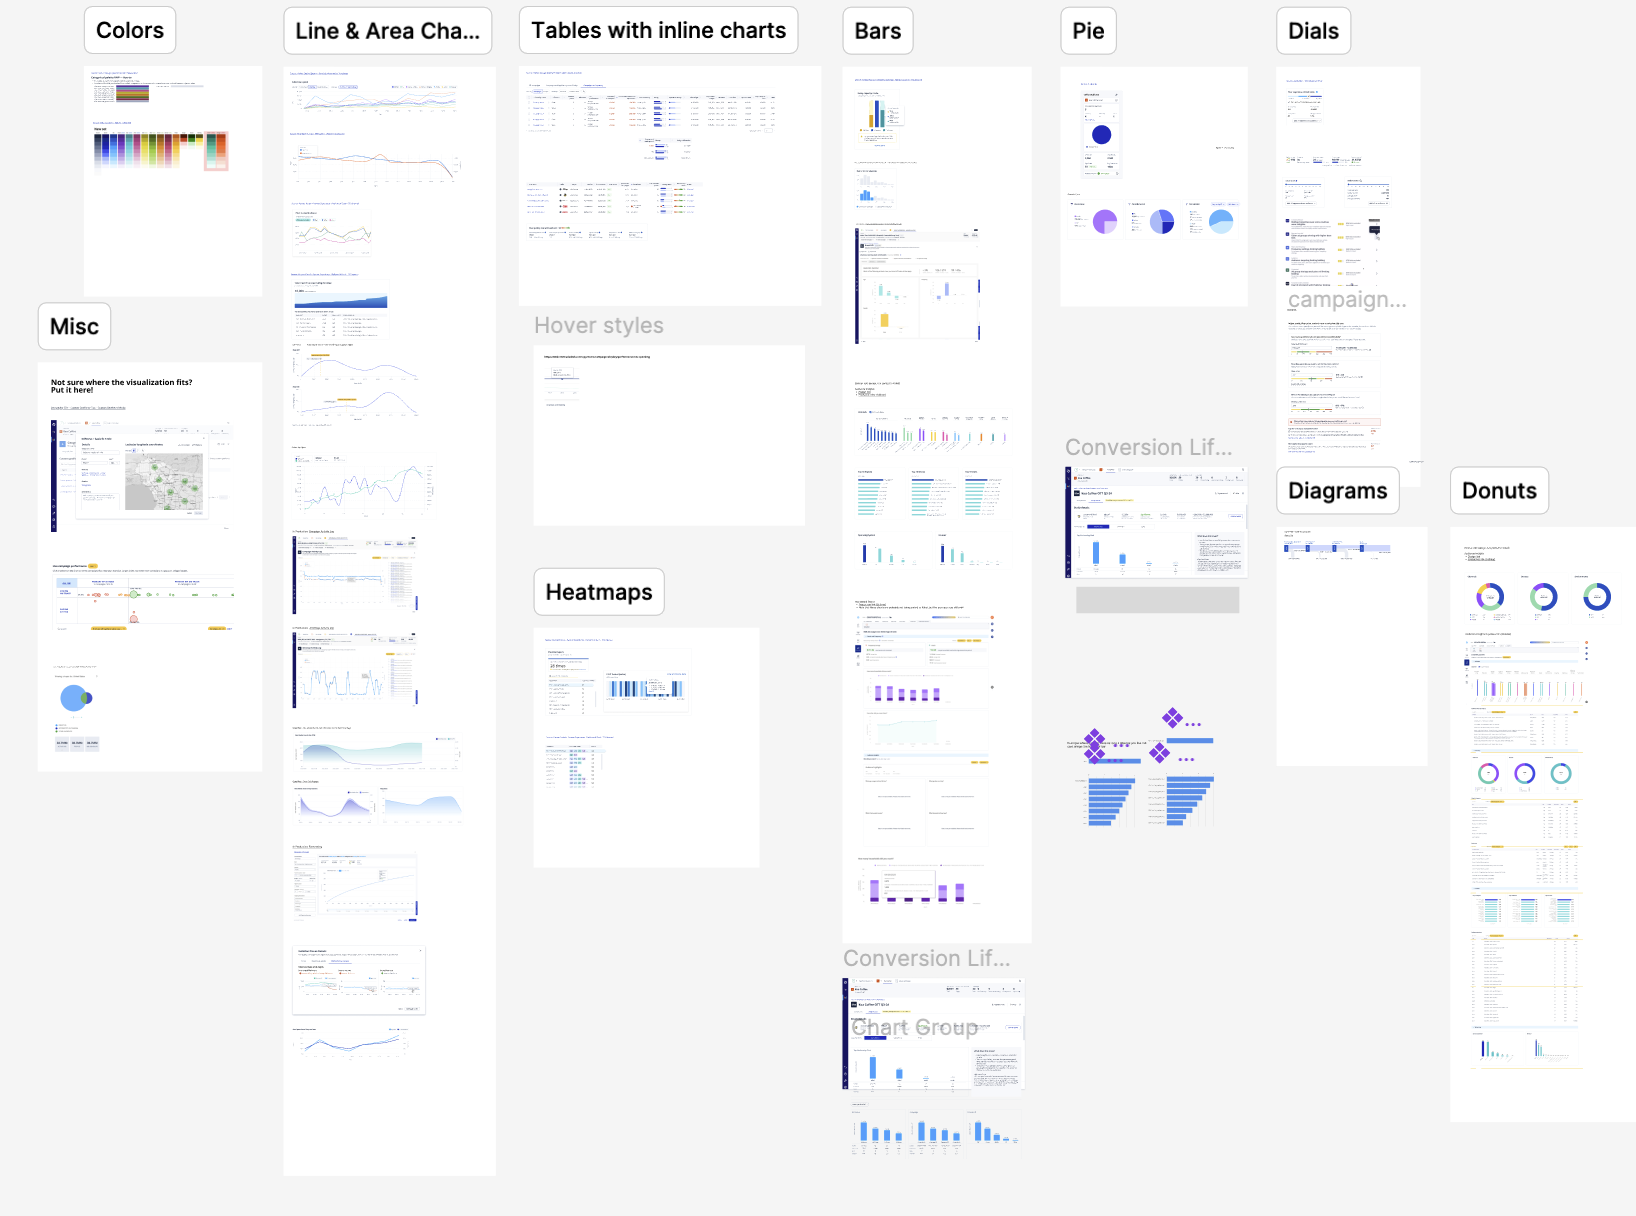
Audit. I catalogued every visualization in the platform to surface inconsistencies and the most common real-world use cases, then turned the findings into a best practices document that anchored the system.
Establish. I defined categorical and diverging color palettes built on the existing corporate palette and tested for color blindness; typography rules, including monospaced numerals so decimals line up in tables; and guidance for gridlines, legends, and axes that reduces clutter.
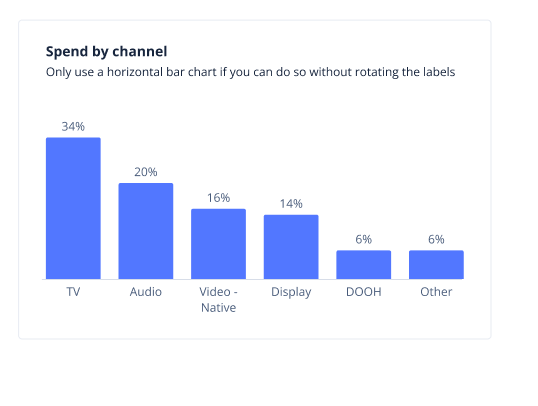
Execute. I built reusable components for the two most common chart types, line and bar charts, with clear guidelines for when and how to use them.
Evolve. I kept adjusting based on real usage. For example, an axis label size that looked clean in mockups turned out to be too small in practice, so I increased it to improve readability across the board.

Key decisions
Extend the brand, don't replace it. The palette built on The Trade Desk's existing colors. Colors that already carried meaning, like yellow, were used sparingly to avoid confusion.
Ship the most common needs first. New chart types are added only when there's a real use case. Guessing what the ideal heatmap should look like would miss real-world constraints.
Put flexibility where it matters. My first line chart component supported 7, 14, and 30-day ranges and any number of lines. Watching usage showed designers almost always needed the 7-day view and two or three lines, so I cut the extra options and invested in fluid resizing instead.
Driving adoption
A design system only works if people use it. I led hands-on workshops for designers and developers that covered the components and broader data literacy, such as when to use a bar chart instead of a line chart and how to avoid misleading scales. Framing the system as a storytelling tool, not just a standardization exercise, led to stronger buy-in and more thoughtful usage across teams.

The outcome
A consistent, accessible visual language for charts across the platform, reusable line and bar chart components, and a best practices guide, plus a design and engineering team better equipped to make good data visualization decisions on their own.
Lessons learned
Start small. Beginning with line and bar charts gave the system a strong foundation without overwhelming scope.
Let use cases guide you. Real scenarios from the audit and workshops drove every guideline.
Leave room to evolve. Systems thrive when they're flexible enough to change as new needs arise.
Componentize with care. More configurability isn't always better. Focus on what designers actually need most often.