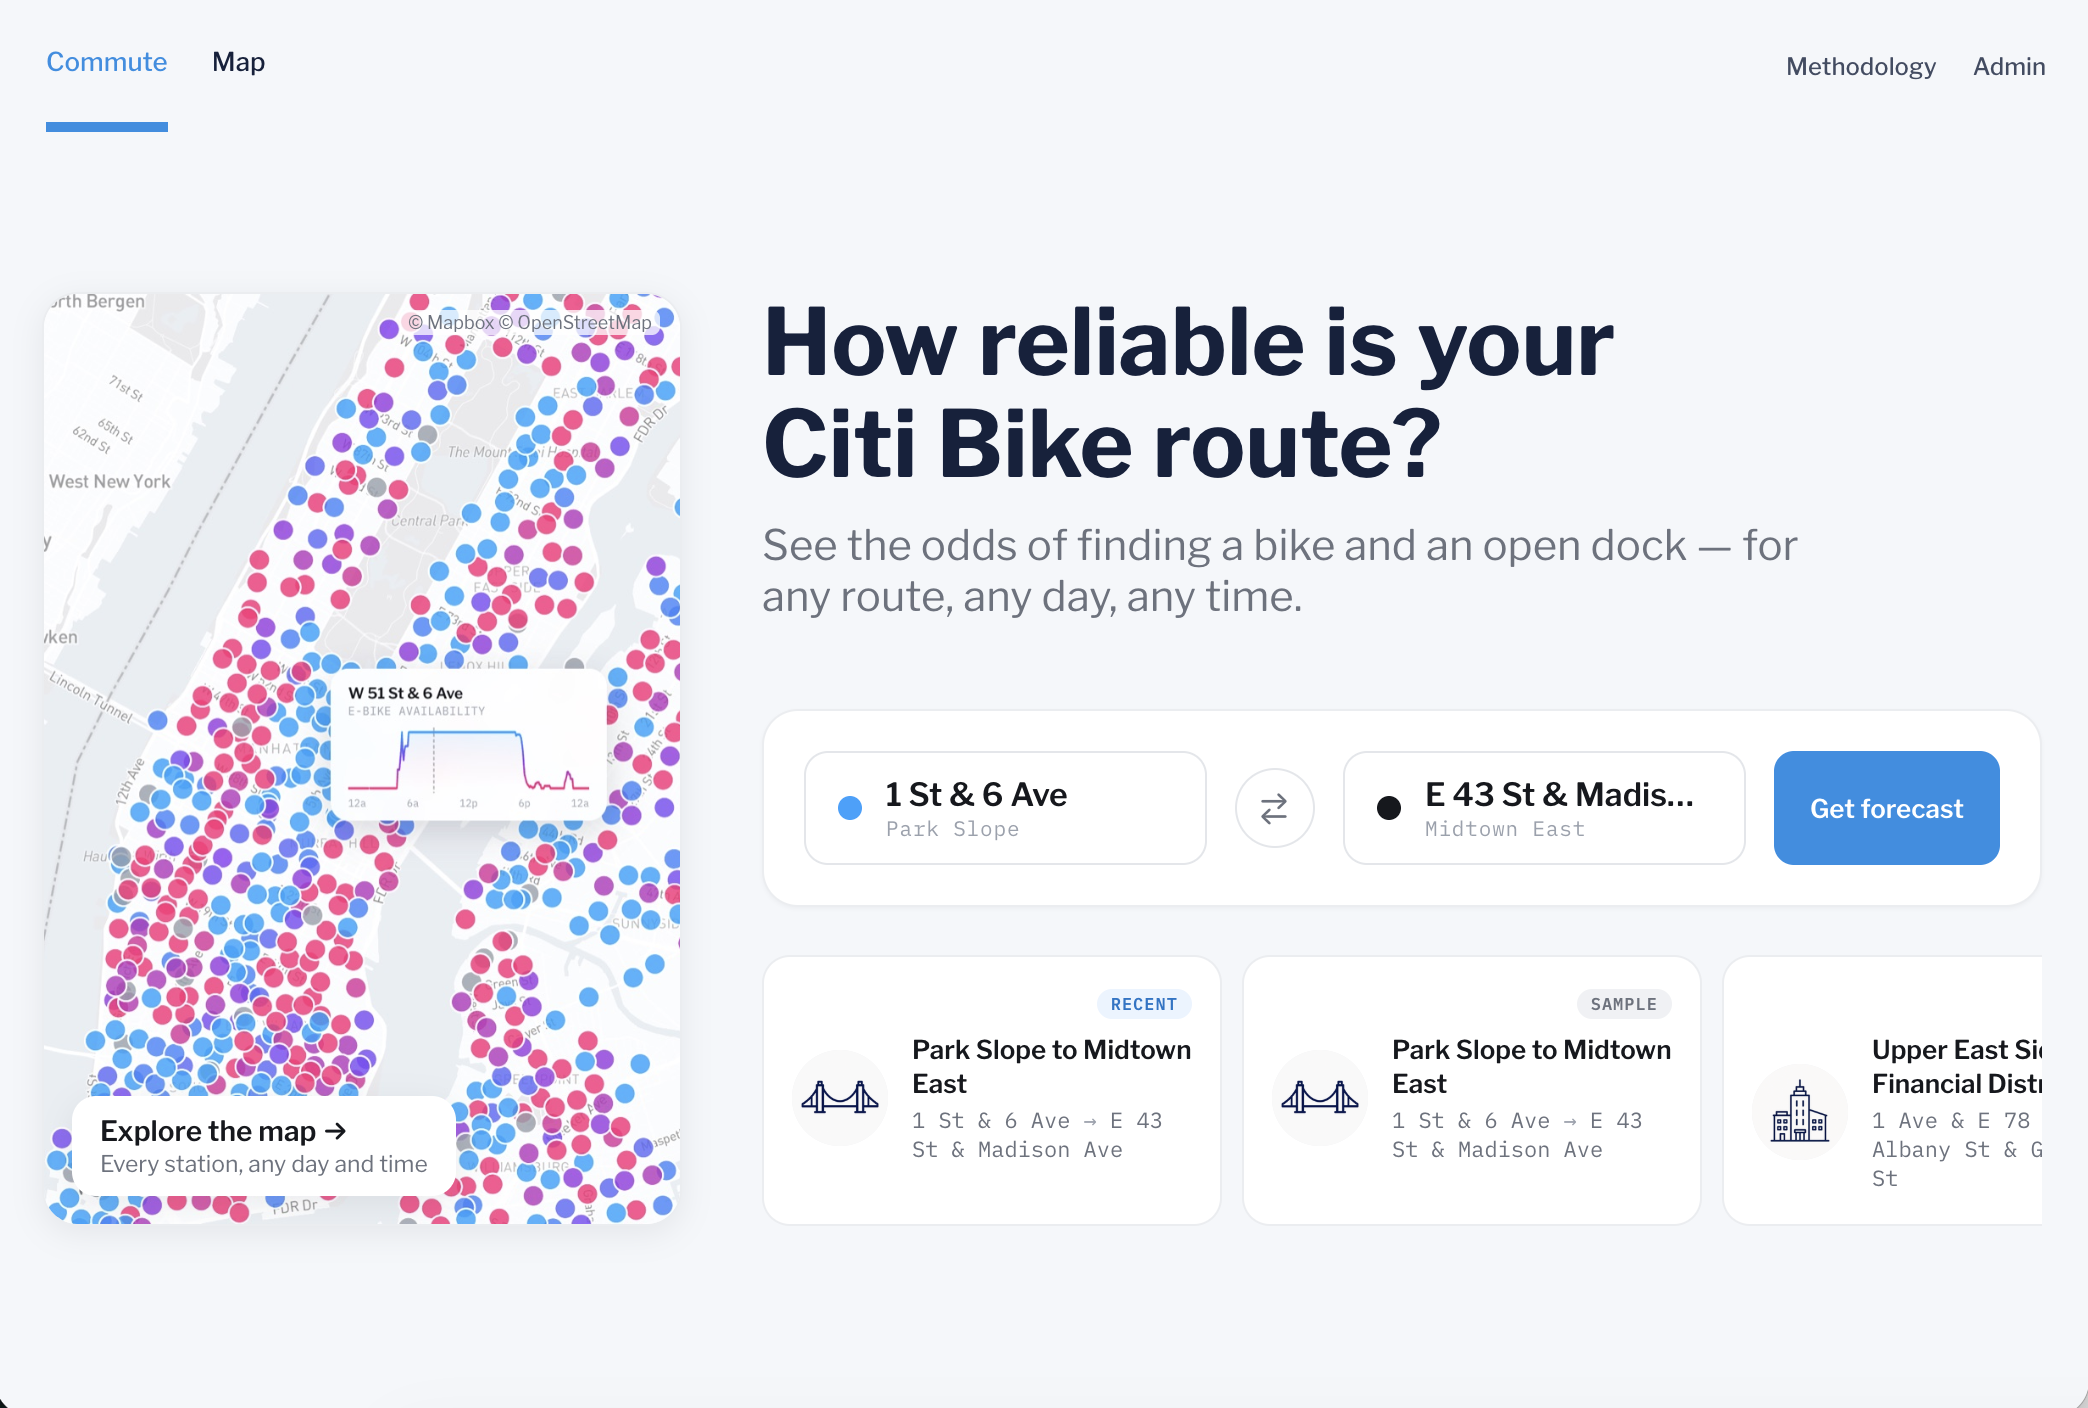
Will there be a Citi Bike?
Citi Bike's app tells you what's at a station right now. This tells you what's usually there when you'll actually show up, for any route, any day of the week, any time.
The goal
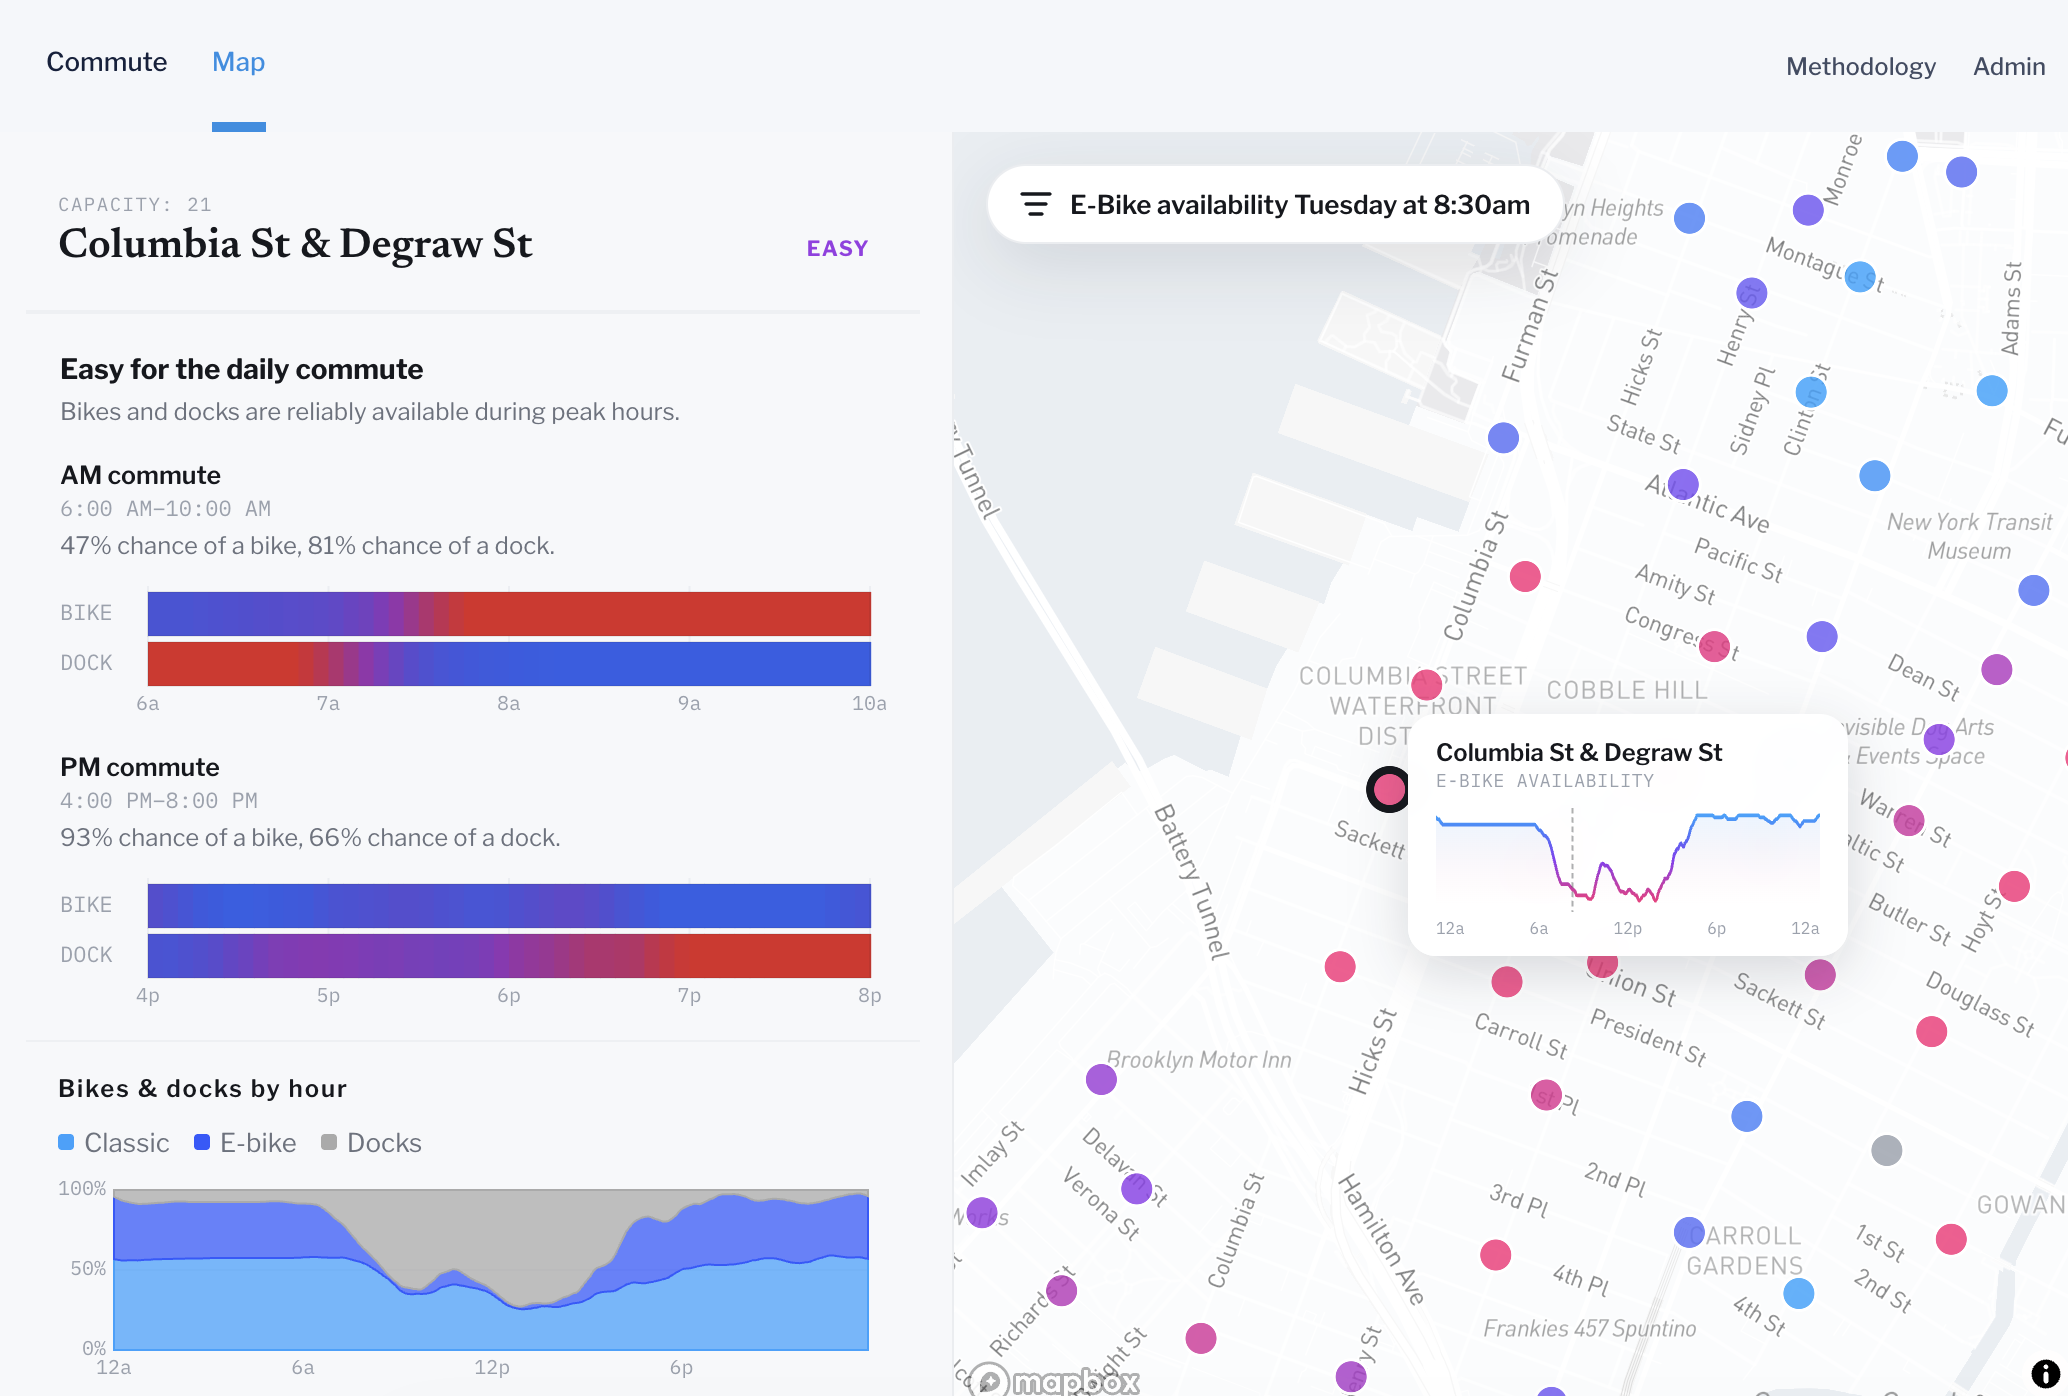
Anyone who rides Citi Bike to work knows the two ways a commute fails: the station by your apartment is empty, or the station by your office is full and you circle the block looking for a dock. Both are predictable. They happen at the same stations, on the same days, at the same times, week after week.
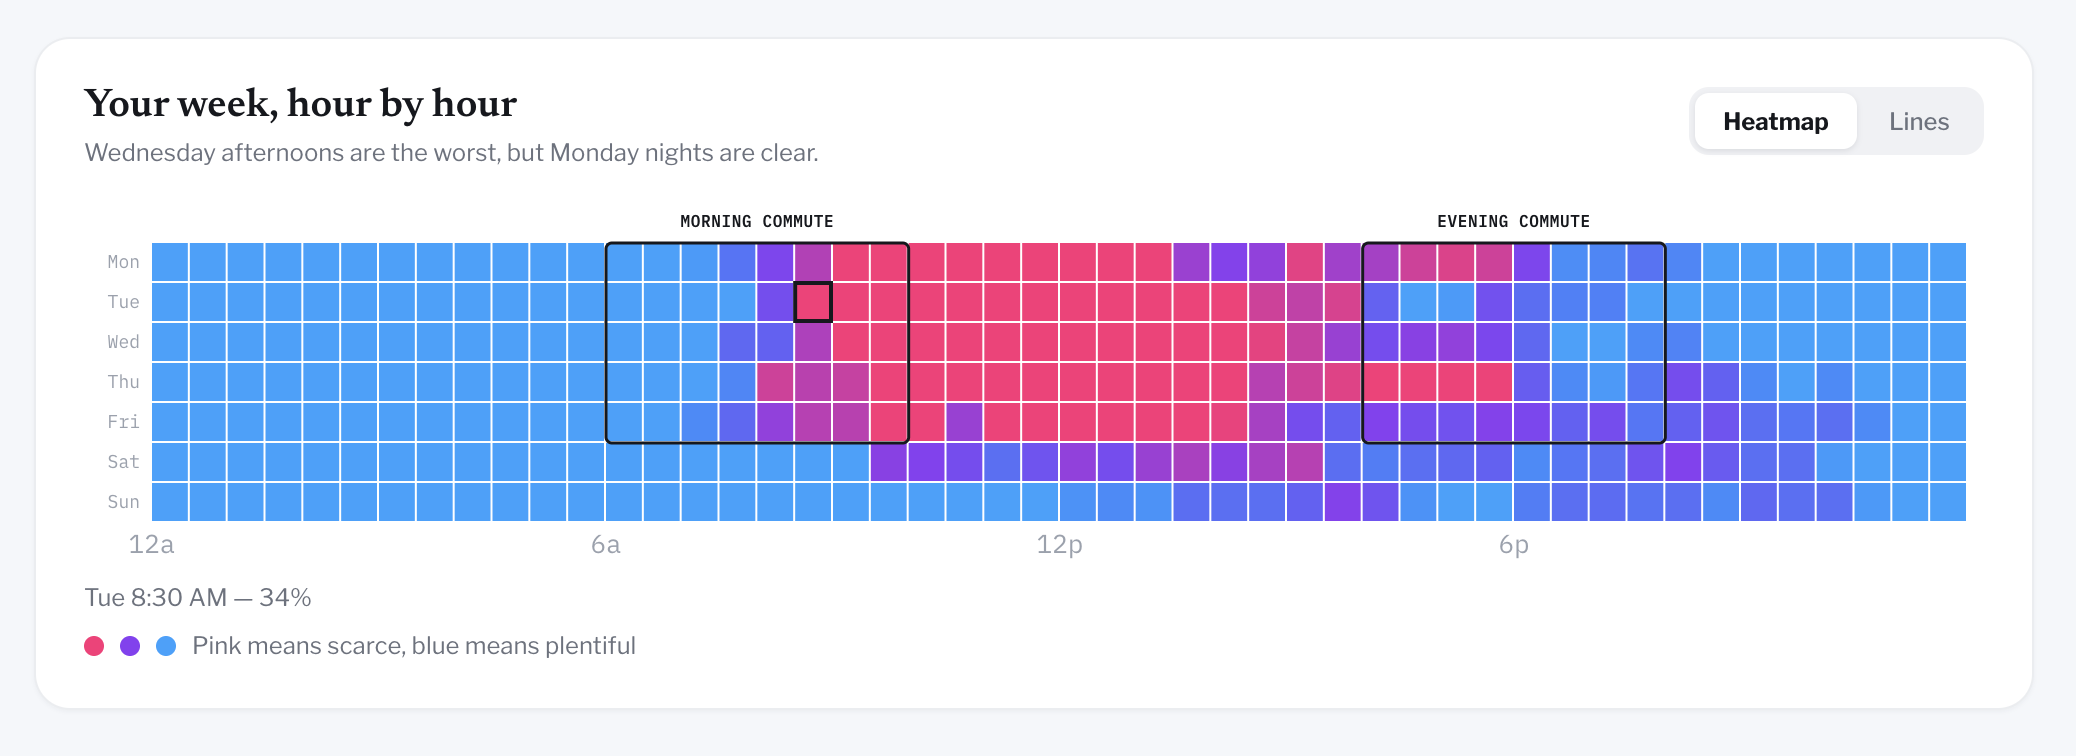
The goal was to make that pattern visible as easily as possible. You pick a start and end station, and the app shows your chance of getting a bike and finding a dock when you'd arrive, then shows the whole week so you can see when it gets risky and how much earlier you'd need to leave.
How the odds are calculated
Every five minutes the app records how many bikes, e-bikes and open docks each station has. For a station, day of the week and time, the chance of availability is the share of past snapshots, on the same weekday over the last 90 days, that had at least two bikes or docks available. I set the availability threshold to two bikes or docks because in practice one bike left is as good as none. In the case of e-bikes, a single bike left might only have 1 mile of range left or disappear before you arrive.
A commute succeeds if there's at least two bikes at the start two docks at the end. Arrival time comes from the straight-line distance at an average riding speed of 12 mph.
P(bike)    = snapshots with ≥2 bikes  ÷ snapshots in window   (start station, departure time)
P(dock)    = snapshots with ≥2 docks  ÷ snapshots in window   (end station, arrival time)
P(success) = P(bike) × P(dock)
Technical setup
A small, single-service backend does the collecting and the math; a React front end turns the numbers into charts and maps.
Polling the feed. A background job fetches Citi Bike's public GBFS feed every five minutes and appends one row per station: bikes, classic bikes, e-bikes and open docks. Station names, locations and capacity refresh hourly, and new stations are reverse-geocoded to a neighborhood so they read as "Park Slope" rather than a street corner. The jobs run on APScheduler inside the API process, so there's one service to deploy, and each job is guarded so a slow run can't overlap the next.
Storage. Everything lives in a single SQLite file on a persistent volume. Write-ahead logging lets the collector write while the API reads, without either one blocking. The raw snapshot table is append-only and never rewritten; everything the app reads is derived from it.
Serving. FastAPI serves the probability, commute and map endpoints. The front end is React built with Vite, with Mapbox GL for maps, D3 charts, and Zustand for shared state. Both deploy as Docker containers on Railway, with nginx serving the static front end.